(0)目次&概説
(1) 記事の目的
(2) LineChartの表示改善
(2-1)【線】線の太さを変更
(2-2)【線】各シリーズ(Series)毎に折れ線の色を設定
(2-3)【線】各シリーズ(Series)の点毎に値を表示
(2-4)【線】各シリーズ(Series)の点毎に表示する情報を制御
(2-5)【線】各シリーズ(Series)の点毎に図形を表示するか?の制御
(2-6)【背景】グラフの背景色を変更
(2-7)【背景】グラフにX軸・Y軸のグリッド線を表示
(2-8)【背景】凡例の表示位置を変更
(2-9)【軸】両端のマージンを削除する
(2-10)【軸】Y軸の始点・終点の数値を指定
(2-11)【軸】X軸のラベル表示を横書きから縦書きに変更
(3) サンプルプログラム
(3-1) 対応実施前(Before)
(3-2) 対応実施後(After)
(4) その他
(4-1) LineChartでX軸方向の点を間引く
(4-2) LineChartでX軸を日付順番でソート
(4-3) Category Plot型とXY Plot型
(1) 記事の目的
JFreeChartの導入や疎通が済んでいるという前提で、今回の記事では「LineChart」(折れ線グラフ)に絞って「グラフをより綺麗に見せる為の便利テクニック」を紹介していきます。
JFreeChartの導入や疎通これから実施する方は以下の記事を参考にしてみて下さい。
JFreeChartを使ってJavaで様々なグラフを簡単に描画する方法
JFreeChartで描画したグラフをJSP/Servlet画面に表示する方法
(2) 実施手順
(2-1)【線】線の太さを変更
・第一引数はシリーズの番号指定です(追加した順番に0,1,2,・・・と数字が増えていきます)
・第二引数で線の太さを指定しています。「BasicStroke」の引数の数字は線の太さを表しています。
(追加コード例)
[JFreeChart型インスタンス].getCategoryPlot().getRenderer().setSeriesStroke(0,new BasicStroke(4));
(2-2)【線】各シリーズ(Series)毎に折れ線の色を設定
・第一引数はシリーズの番号指定です(追加した順番に0,1,2,・・・と数字が増えていきます)
(追加コード例)
CategoryPlot plot = [JFreeChart型インスタンス].getCategoryPlot();
LineAndShapeRenderer renderer = (LineAndShapeRenderer)plot.getRenderer();
renderer.setSeriesPaint(0, ChartColor.RED);
(2-3)【線】各シリーズ(Series)の点毎に値を表示
・第一引数はシリーズの番号指定です(追加した順番に0,1,2,・・・と数字が増えていきます)
・プロットされた点が軸から離れていたりすると、点のX値やY値が読取りにくくなるケースがあります。そうした不便さを解消するために利用できます。
・第三引数では方角を制御しており、上の例ではTOP_CENTERなので点の上中央に値を表示し、下の例では点の下中央に表示させています。
(追加コード例)
CategoryPlot plot = [JFreeChart型インスタンス].getCategoryPlot();
LineAndShapeRenderer renderer = (LineAndShapeRenderer)plot.getRenderer();
renderer.setSeriesPositiveItemLabelPosition(0, new ItemLabelPosition(ItemLabelAnchor.OUTSIDE8,TextAnchor.TOP_CENTER));
(2-4)【線】各シリーズ(Series)の点毎に表示する情報を制御
・私の場合、各点にはY軸の値を添えたかったため、第一引数には「{2」}を指定しています。
・setBaseItemLabelsVisibleで表示のON/OFFを切替えています。
(追加コード例)
CategoryPlot plot = [JFreeChart型インスタンス].getCategoryPlot();
LineAndShapeRenderer renderer = (LineAndShapeRenderer)plot.getRenderer();
renderer.setBaseItemLabelGenerator(new StandardCategoryItemLabelGenerator("{2}",NumberFormat.getInstance()));
renderer.setBaseItemLabelsVisible(true);
(2-5)【線】各シリーズ(Series)の点毎に図形を表示するか?の制御
・第一引数はシリーズの番号指定です(追加した順番に0,1,2,・・・と数字が増えていきます)
・第二引数のbooleanフラグでON/OFFの指定をしています。
(追加コード例)
CategoryPlot plot = [JFreeChart型インスタンス].getCategoryPlot();
LineAndShapeRenderer renderer = (LineAndShapeRenderer)plot.getRenderer();
renderer.setSeriesShapesVisible(0, true);
(2-6)【背景】グラフの背景色を変更
・例では引数で「Color.WHITE」と白色の指定をしていますが、この「Color」クラスはJavaのAWT(Abstract Window Toolkit)のライブラリのクラスを用いています。
(追加コード例)
[JFreeChart型インスタンス].getPlot().setBackgroundPaint(Color.WHITE);
(2-7)【背景】グラフにX軸・Y軸のグリッド線を表示
・「CategoryPlot」クラスで表の中の表示を制御しています。
・「Domain」がX軸で「Range」がY軸を表しています。
・「RangeGridlinesVisible」でY軸方向のグリッド線の表示の有無を指定しています。
・「RangeGridlinePaint」でY軸方向のグリッド線の色の指定しています。
(追加コード例)
CategoryPlot plot = [JFreeChart型インスタンス].getCategoryPlot();
plot.setRangeGridlinesVisible(true);
plot.setRangeGridlinePaint(Color.BLACK);
plot.setDomainGridlinesVisible(true);
plot.setDomainGridlinePaint(Color.BLACK);
(2-8)【背景】凡例の表示位置を変更
・「LegendTitle」クラスで凡例の表示を制御しています。
・setPosition()メソッドで位置を指定できます(上下左右が指定可能。個人的には8方角の指定がしたい・・・)
(追加コード例)
LegendTitle legend = [JFreeChart型インスタンス].getLegend();
legend.setPosition(RectangleEdge.LEFT);
(2-9)【軸】両端のマージンを削除する
・CategoryAxisのインスタンスはデフォルトで自動のマージンを設定するため、もし両端の余白が不要であれば本コマンドで手動の削除を行います。
(追加コード例)
CategoryPlot plot = [JFreeChart型インスタンス].getCategoryPlot();
CategoryAxis axis = (CategoryAxis)plot.getDomainAxis();
axis.setUpperMargin(0);
axis.setLowerMargin(0);
(2-10)【軸】Y軸の始点・終点の数値を指定
・「NumberAxis」クラスで軸の表示を制御します。
・軸の始点と終点を任意に指定したい時に利用できます。私の場合ランキングのグラフ等、1位が上に来るケースで使いました(※グラフの各点の数字が上端に近いケースで切れてしまう問題に対応するため、Y軸の上限をマイナスの値に設定する事で上端に余白を与えて、数字が切れないようにする)。
(追加コード例)
CategoryPlot plot = [JFreeChart型インスタンス].getCategoryPlot();
NumberAxis yNumAxis = (NumberAxis)plot.getRangeAxis();
yNumAxis.setLowerBound(-50);
(2-11)【軸】X軸のラベル表示を横書きから縦書きに変更
・「CategoryLabelPositions.DOWN_90」は右方向に90度回転の意味です。
・データ数が非常に多い場合に有効です。データが多いと横書きのX軸ラベルはお互いに文字が被ってしまうため、縦書きにする事で、同じX軸の幅の中により多くのラベルを表示する事ができます。
(追加コード例)
CategoryPlot plot = [JFreeChart型インスタンス].getCategoryPlot();
CategoryAxis axis = (CategoryAxis)plot.getDomainAxis();
axis.setCategoryLabelPositions(CategoryLabelPositions.DOWN_90);
(3) サンプルプログラム
(3-1) 対応実施前(Before)
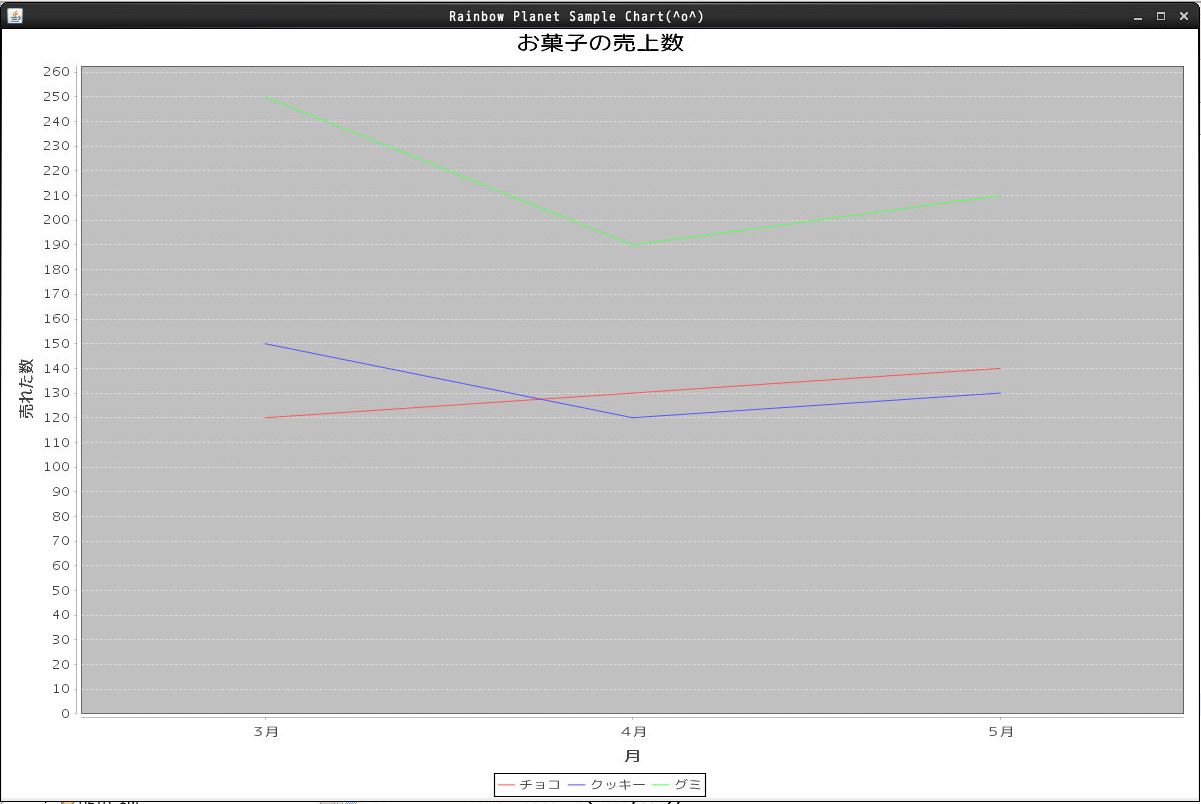
こちらがBeforeのLineChartを描画するための最小限のプログラムです。
package jfreechart;
import org.jfree.chart.ChartFactory;
import org.jfree.chart.ChartFrame;
import org.jfree.chart.JFreeChart;
import org.jfree.chart.plot.PlotOrientation;
import org.jfree.data.category.DefaultCategoryDataset;

public class IT0091_JFreeChartSampeCategoryChartPrettify {
        public static void main(String args[]) {
                //(1)データセットの作成
                DefaultCategoryDataset ds_cat = new DefaultCategoryDataset();
                ds_cat.setValue(120,"チョコ","3月");
                ds_cat.setValue(130,"チョコ","4月");
                ds_cat.setValue(140,"チョコ","5月");
                ds_cat.setValue(150,"クッキー","3月");
                ds_cat.setValue(120,"クッキー","4月");
                ds_cat.setValue(130,"クッキー","5月");
                ds_cat.setValue(250,"グミ","3月");
                ds_cat.setValue(190,"グミ","4月");
                ds_cat.setValue(210,"グミ","5月");

                //(2)チャートの作成
                JFreeChart chart=ChartFactory.createLineChart("お菓子の売上数", "月", "売れた数", ds_cat, PlotOrientation.VERTICAL, true, false, false);

                //(3)出力処理
                ChartFrame frame1 = new ChartFrame("Rainbow Planet Sample Chart(^o^)", chart);
                frame1.setVisible(true);
                frame1.setSize(1200,800);
        }
}
(図001)Before実行結果
(3-2) 対応実施後(After)
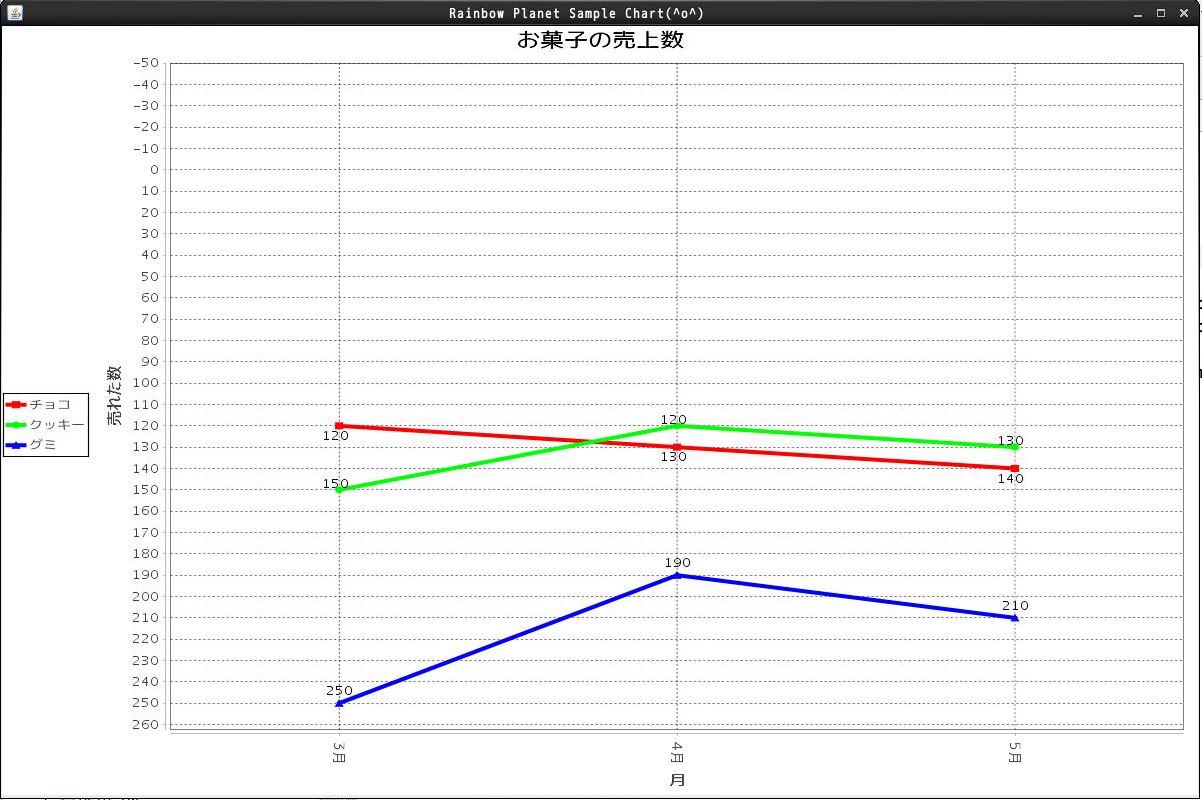
こちらがAfterのプログラムです。上記のBeforeのプログラムに対して、2章の1~11のポイントを追加しています。
package jfreechart;
import java.awt.BasicStroke;
import java.awt.Color;
import java.text.NumberFormat;

import org.jfree.chart.ChartColor;
import org.jfree.chart.ChartFactory;
import org.jfree.chart.ChartFrame;
import org.jfree.chart.JFreeChart;
import org.jfree.chart.axis.CategoryAxis;
import org.jfree.chart.axis.CategoryLabelPositions;
import org.jfree.chart.axis.NumberAxis;
import org.jfree.chart.labels.ItemLabelAnchor;
import org.jfree.chart.labels.ItemLabelPosition;
import org.jfree.chart.labels.StandardCategoryItemLabelGenerator;
import org.jfree.chart.plot.CategoryPlot;
import org.jfree.chart.plot.PlotOrientation;
import org.jfree.chart.renderer.category.LineAndShapeRenderer;
import org.jfree.chart.title.LegendTitle;
import org.jfree.data.category.DefaultCategoryDataset;
import org.jfree.ui.RectangleEdge;
import org.jfree.ui.TextAnchor;

public class IT0091_JFreeChartSampeCategoryChartPrettify {
        public static void main(String args[]) {
                //(1)データセットの作成
                DefaultCategoryDataset ds_cat = new DefaultCategoryDataset();
                ds_cat.setValue(120,"チョコ","3月");
                ds_cat.setValue(130,"チョコ","4月");
                ds_cat.setValue(140,"チョコ","5月");
                ds_cat.setValue(150,"クッキー","3月");
                ds_cat.setValue(120,"クッキー","4月");
                ds_cat.setValue(130,"クッキー","5月");
                ds_cat.setValue(250,"グミ","3月");
                ds_cat.setValue(190,"グミ","4月");
                ds_cat.setValue(210,"グミ","5月");

                //(2)チャートの作成
                JFreeChart chart=ChartFactory.createLineChart("お菓子の売上数", "月", "売れた数", ds_cat, PlotOrientation.VERTICAL, true, false, false);
                //線の太さを変更する
                chart.getCategoryPlot().getRenderer().setSeriesStroke(0, new BasicStroke(4));
                chart.getCategoryPlot().getRenderer().setSeriesStroke(1, new BasicStroke(4));
                chart.getCategoryPlot().getRenderer().setSeriesStroke(2, new BasicStroke(4));
                //各シリーズ(Series)毎に折れ線の色を設定する
                CategoryPlot plot = chart.getCategoryPlot();
                LineAndShapeRenderer renderer = (LineAndShapeRenderer)plot.getRenderer();
                renderer.setSeriesPaint(0, ChartColor.RED);
                renderer.setSeriesPaint(1, ChartColor.GREEN);
                renderer.setSeriesPaint(1, ChartColor.BLUE);
                //各シリーズ(Series)の点毎に値(X軸やY軸の値)を表示する
                renderer.setSeriesPositiveItemLabelPosition(0, new ItemLabelPosition(ItemLabelAnchor.OUTSIDE8,TextAnchor.TOP_CENTER));
                renderer.setSeriesPositiveItemLabelPosition(1, new ItemLabelPosition(ItemLabelAnchor.OUTSIDE8,TextAnchor.BOTTOM_CENTER));
                //各シリーズ(Series)の点毎に値として表示する値を制御する
                renderer.setBaseItemLabelGenerator(new StandardCategoryItemLabelGenerator("{2}",NumberFormat.getInstance()));       //Get only the rank number
                renderer.setBaseItemLabelsVisible(true);

                //各シリーズ(Series)の点毎に図形を表示するかどうか?の制御
                renderer.setSeriesShapesVisible(0, true);
                renderer.setSeriesShapesVisible(1, true);
                renderer.setSeriesShapesVisible(2, true);

                //グラフの背景色を変更する
                chart.getPlot().setBackgroundPaint(Color.WHITE);
                //グラフにX軸Y軸のグリッド線を表示する
                plot.setRangeGridlinesVisible(true);
                plot.setRangeGridlinePaint(Color.BLACK);
                plot.setDomainGridlinesVisible(true);
                plot.setDomainGridlinePaint(Color.BLACK);
                plot.getRangeAxis().setInverted(true);
                //凡例の表示位置を変更する
                LegendTitle legend = chart.getLegend();
                legend.setPosition(RectangleEdge.LEFT);
                //Y軸の始点・終点の値を設定する
                NumberAxis yNumAxis = (NumberAxis)plot.getRangeAxis();
                yNumAxis.setLowerBound(-50);
                //X軸のラベル表記を横書きから縦書きに変更
                CategoryAxis axis = (CategoryAxis)plot.getDomainAxis();
                axis.setCategoryLabelPositions(CategoryLabelPositions.DOWN_90);
                axis.setUpperMargin(0);
                axis.setLowerMargin(0);

                //(3)出力処理
                ChartFrame frame1 = new ChartFrame("Rainbow Planet Sample Chart(^o^)", chart);
                frame1.setVisible(true);
                frame1.setSize(1200,800);

        }
}
(図002)After実行結果
(4) その他
(4-1) LineChartでX軸方向の点を間引く
DefaultCategoryDataset型のデータセットの場合、Y軸は数値のためソートが可能ですが、一方のX軸は「カテゴリ」であり文字列(String型)のケースも有り得るため、原則は間引く事は出来ない仕様になっています(間引くとデータ自体の欠損が生じる可能性があるため)。
もしX軸も数値型の軸で、値が非常に多いため間引きたいという場合は、XYSeriesCollection型のデータでXYLineChartで描く事によってX方向の間引き機能も利用できます。
>目次にもどる
(4-2) LineChartでX軸を日付順番でソート
点を間引く時と同じ話で、DefaultCategoryDataset型のデータセットの場合はX軸方向のソートが出来ません(軸の各値が文字列の可能性もあるため)。ですので、もしソートしたいという場合に考えられるアプローチとして「DefaultCategoryDataset」にsetValueで値を追加する際に「ソートされた状態で追加する」事が考えられます。値を追加する際は別のシリーズの値が交互に追加されようが、シリーズ名さえ与えていればJFreeChart側で区別が可能です。なのでシリーズは気にせず、とにかくX軸方向でソートされた状態でデータセットを形成していけば、実際に表示した際にX軸のソートが正しく表示できるはずです。
>目次にもどる
(4-3) Category Plot型とXY Plot型
・Category Plot型
Y軸は数値だがX軸が数値でないもの(商品の売り上げ比較等)といったビジネス向けのグラフ描画に利用します。DatasetとRendererはCategory型をセットします。
・XY Plot型
X軸Y軸が両方とも数値のグラフといった、数学的なグラブ描画の際に利用します。DatasetとRendererはXY Plot型をセットします。
