<目次>
Azure Synapse Analyticsの使い方(データ統合のやり方)
やりたいこと/概要
STEP0:前提
STEP1:Synapseのワークスペースのセットアップ
STEP2:「サーバレスSQLプール」を使った分析
STEP3:「データエクスプローラー」を使った分析
STEP4:REST APIからのデータ取得
STEP5:パイプラインとの連携
【注意】Azure Synapse Analyticsの料金について
Azure Synapse Analyticsの使い方(データ統合のやり方)
やりたいこと/概要
●やりたいこと
・Azure Synapse Analyticsの基本的な使い方を習得したい
・様々なソースのデータを結合して、データベースに投入する
●概要
・クラウドベースのデータ統合および分析サービス
・データの取り込み、管理、処理、および可視化を支援する
以降は下記のチュートリアルに沿って進めてみます。
「Get Started with Azure Synapse Analytics」
STEP0:前提
STEP1:Synapseのワークスペースのセットアップ
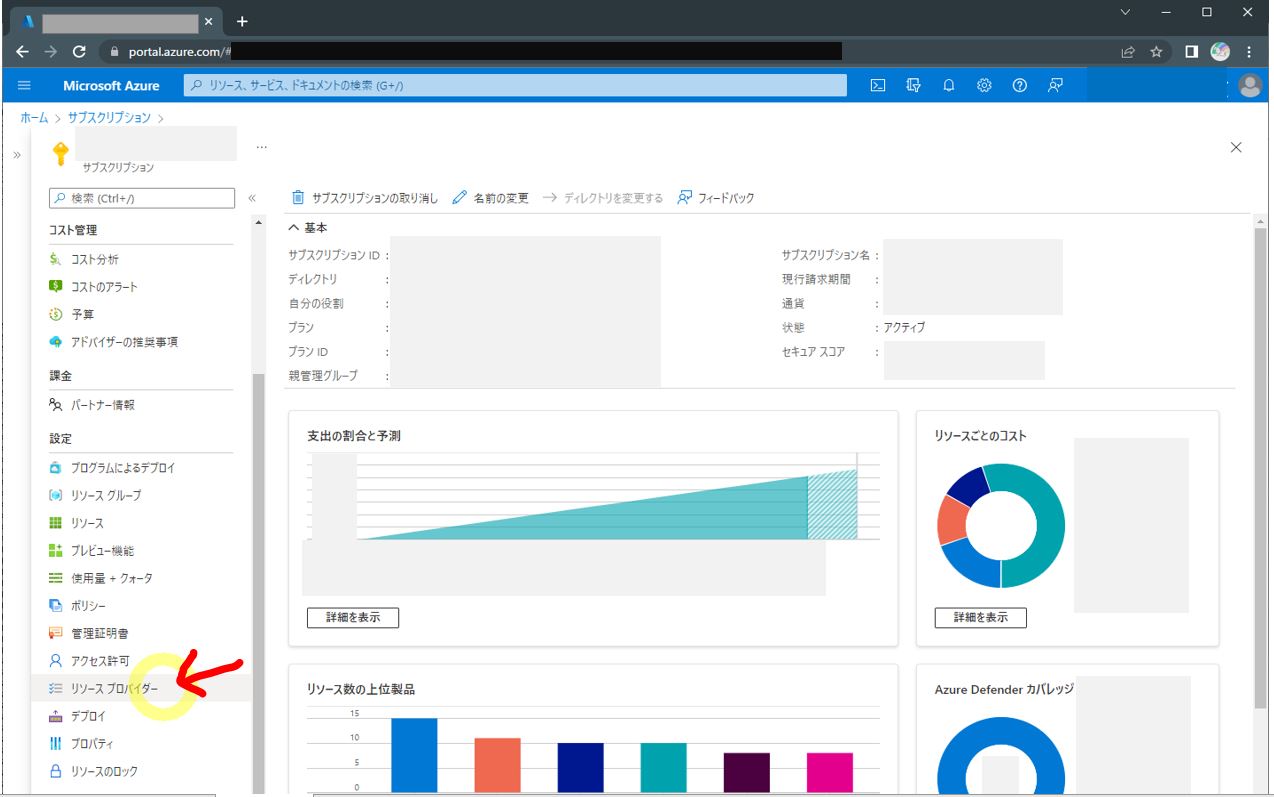
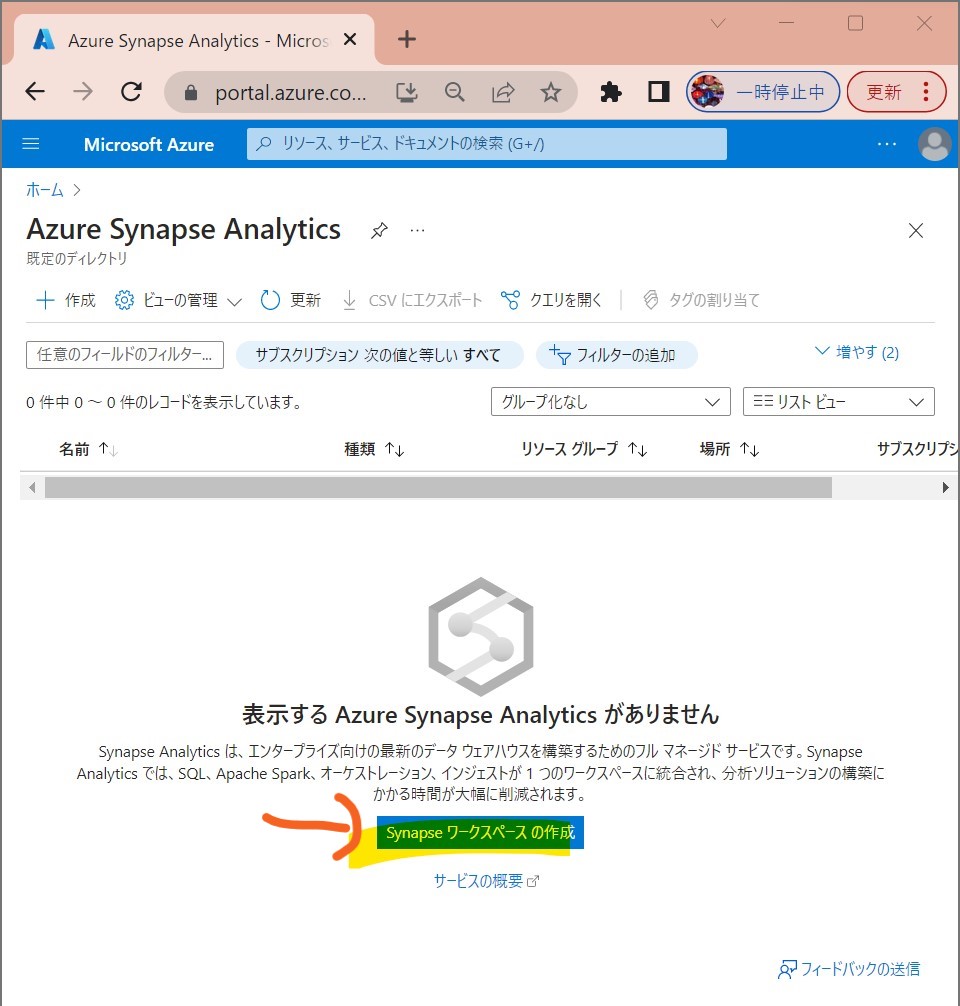
STEP1-1:リソースの作成
・①「Synapseワークスペースの作成」を押下
(図111)
↓
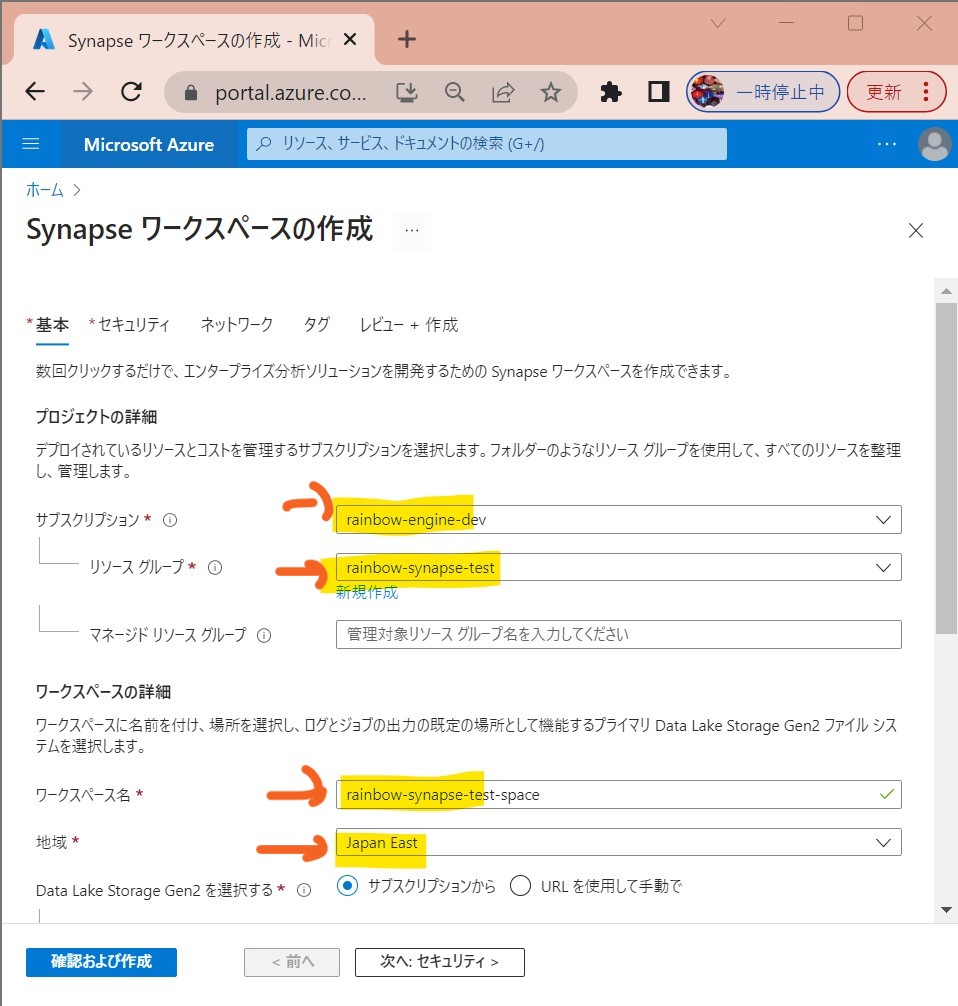
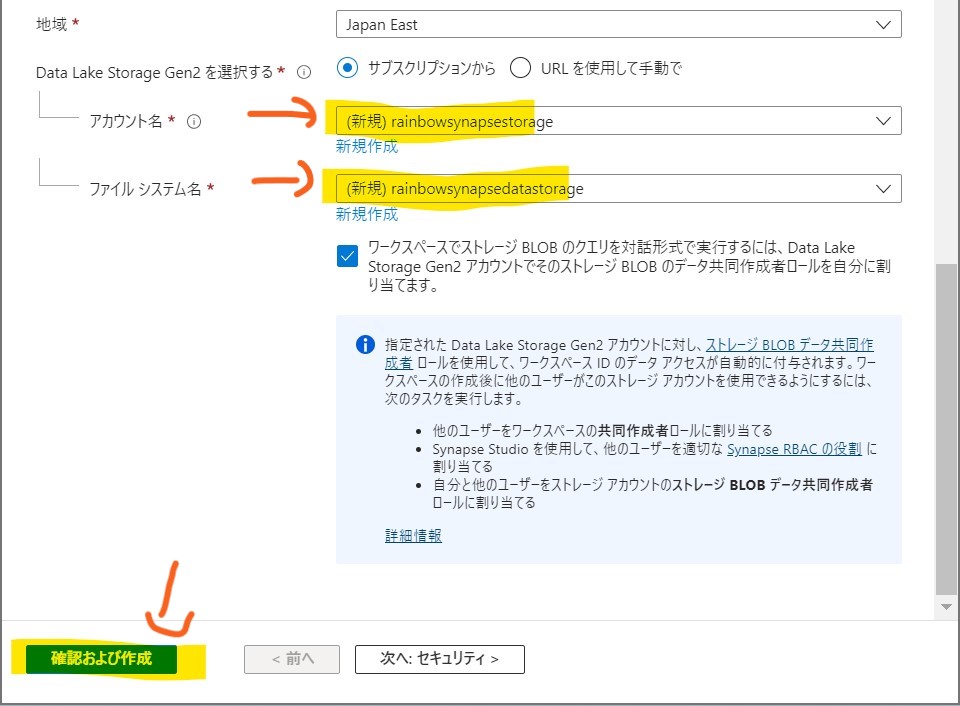
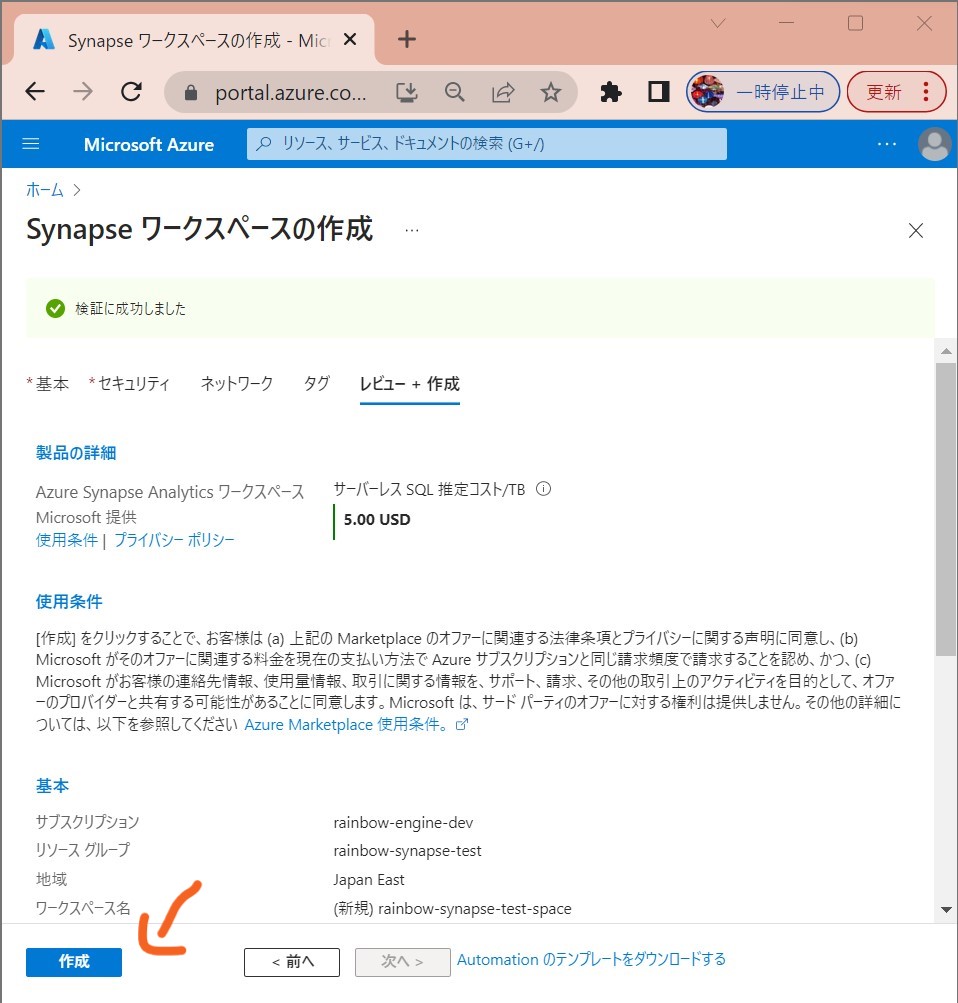
・②必要項目を入力して「確認および作成」
(図112①②)
↓
・③「作成」
(図113)
↓
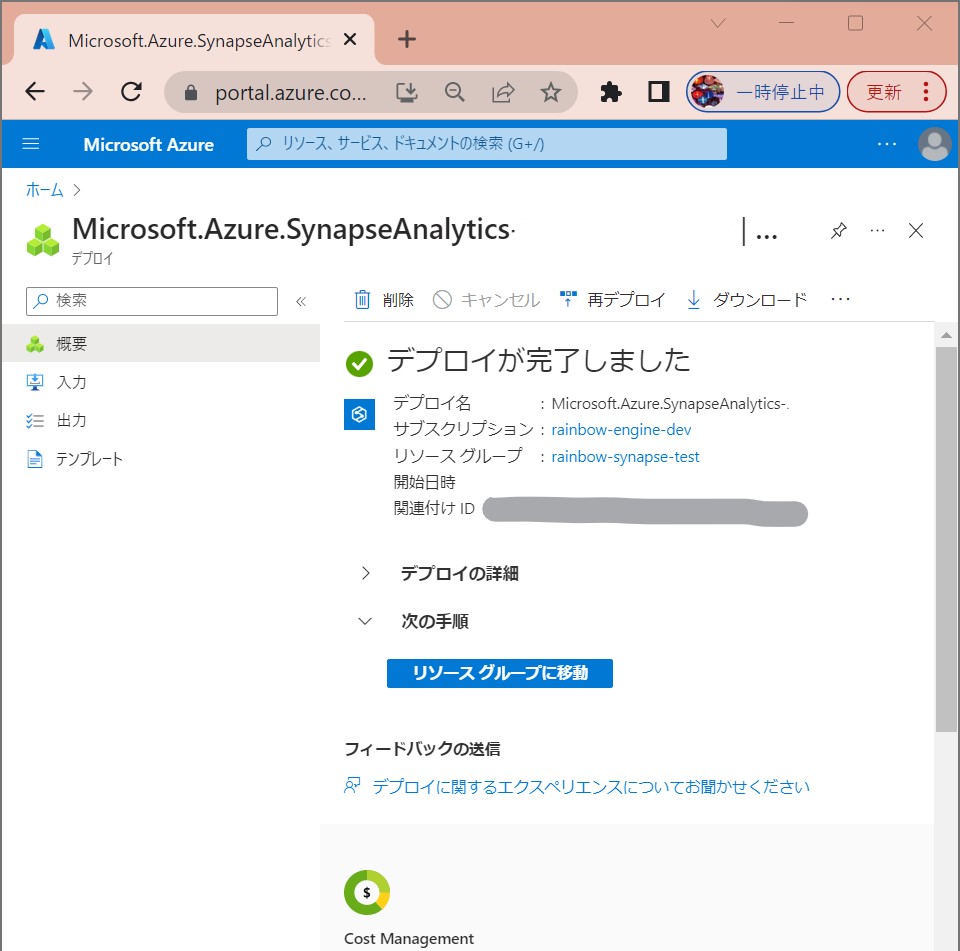
・④「作成完了」
(図114)
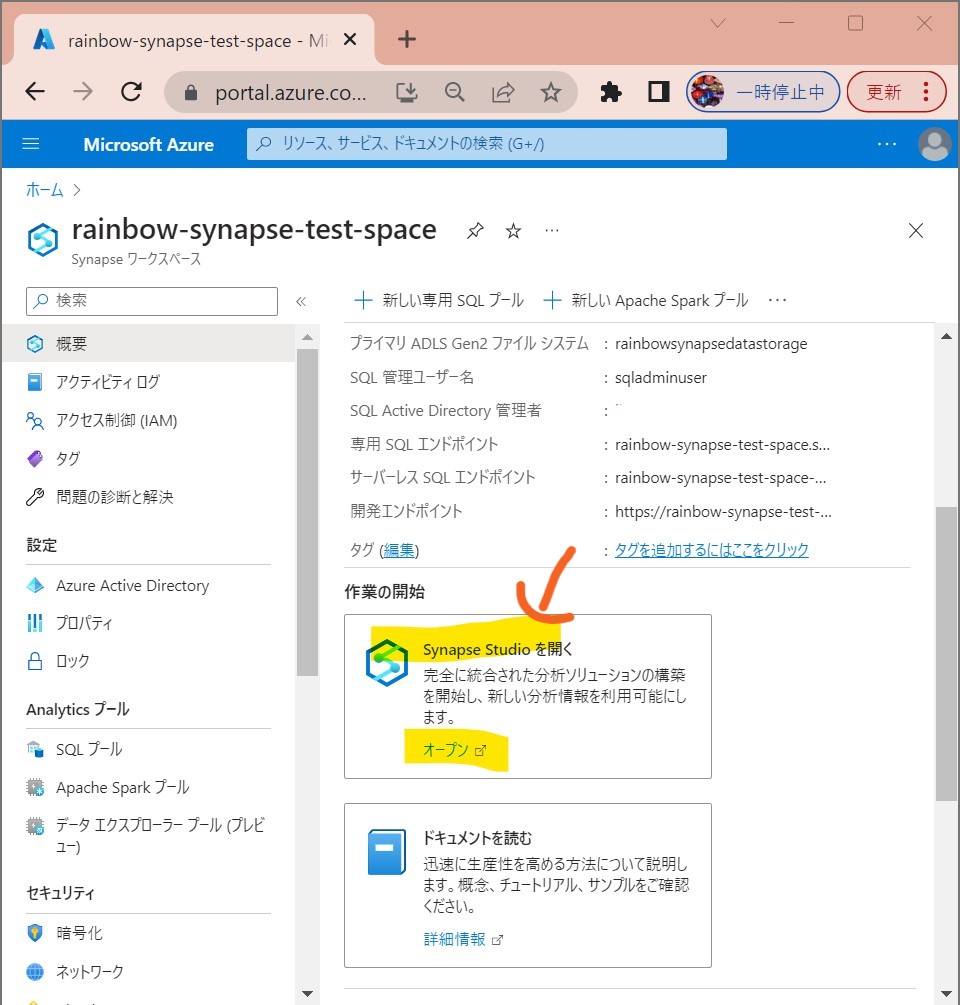
STEP1-2:Synapse Studioを開く
・①「Synapse Studioを開く」
(図131)
↓
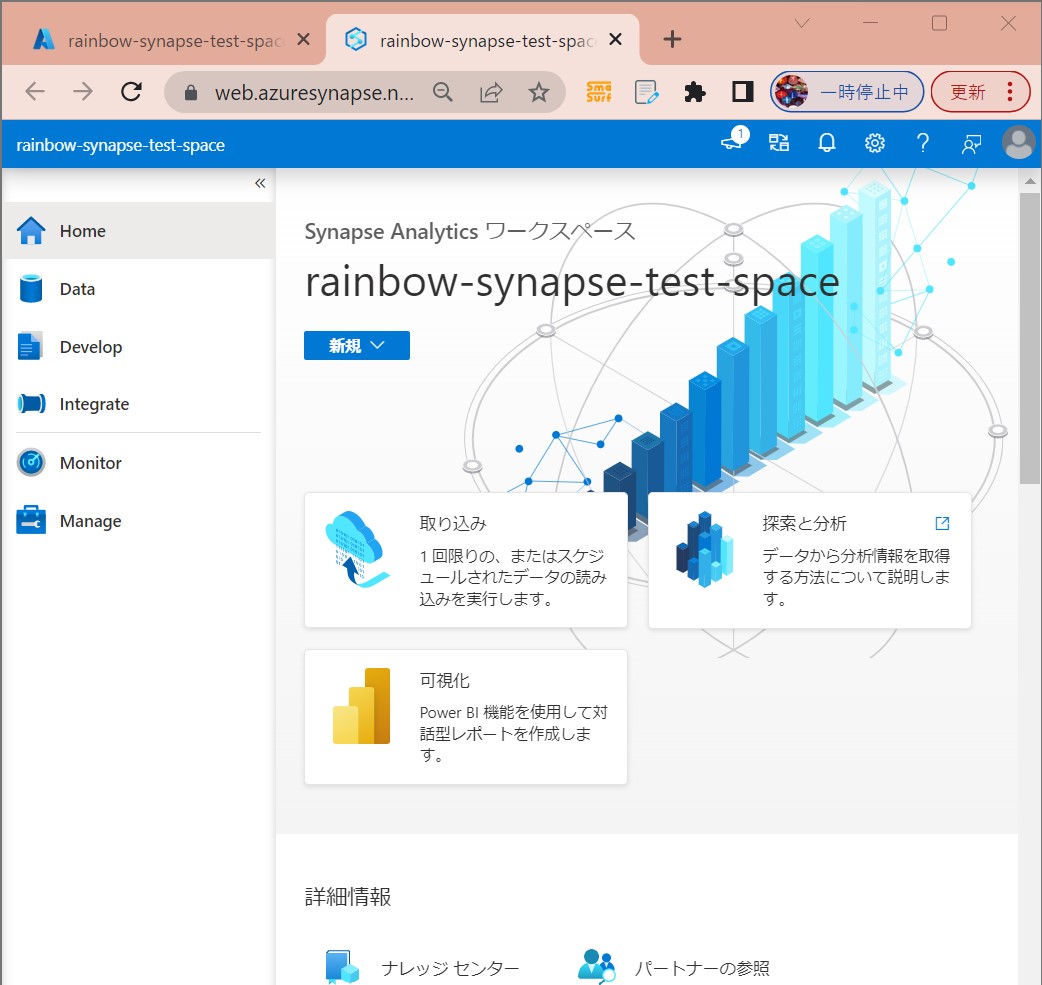
・②スタジオが起動
https://web.azuresynapse.net/
(図132)
STEP1-3:データの準備(サンプル)
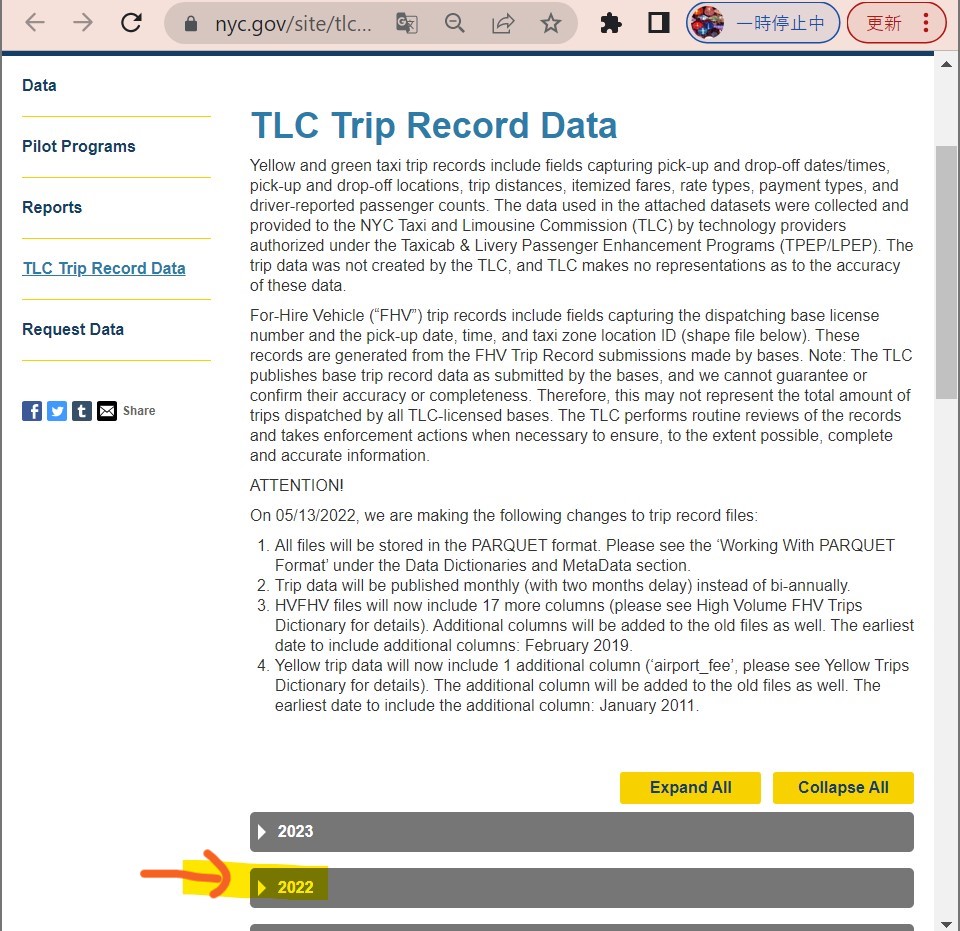
・①サンプルデータのサイトを開く
(図211)
↓
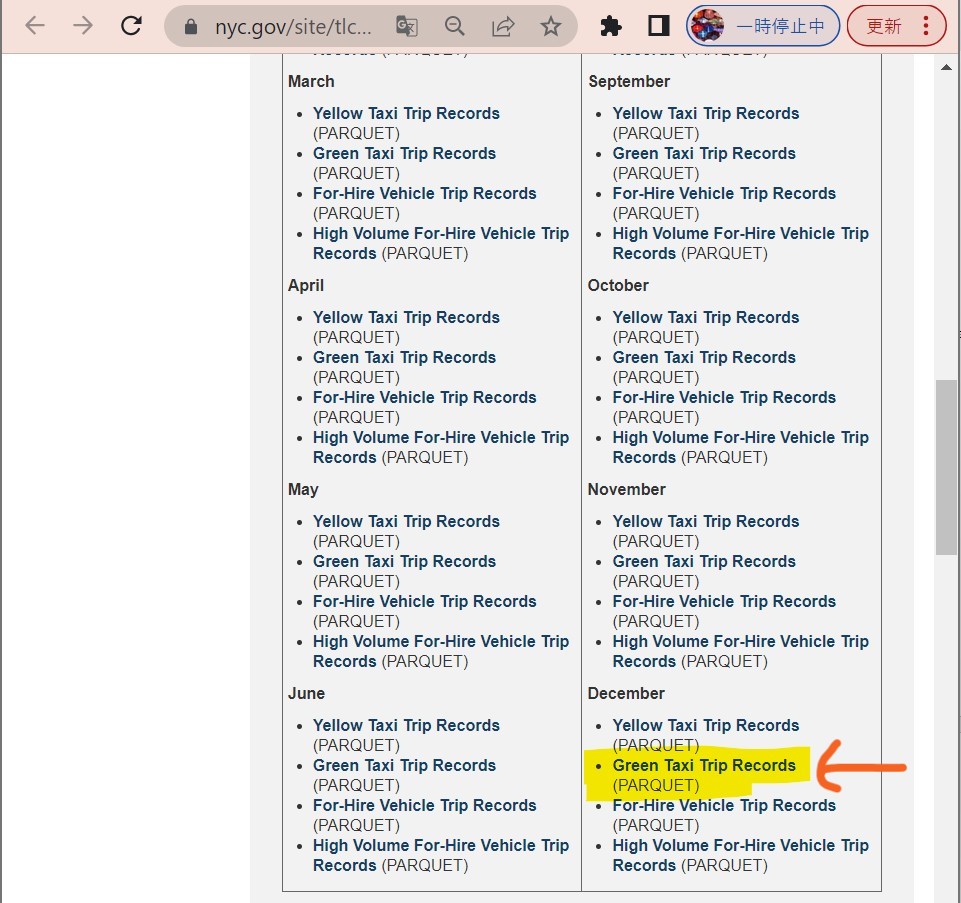
・②「Green Taxi Trip Records」を選択
(図212)
↓
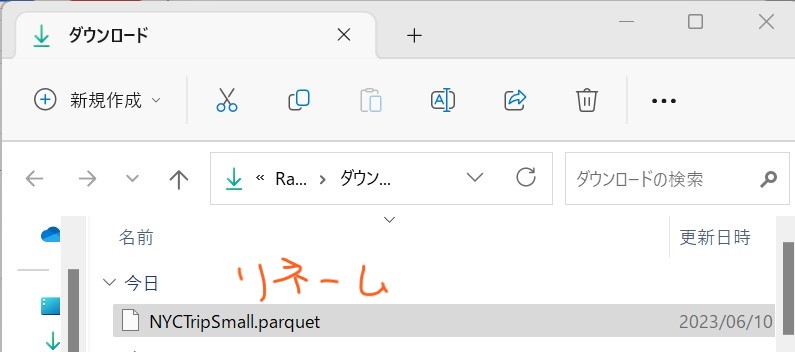
・③リネーム
(図213)
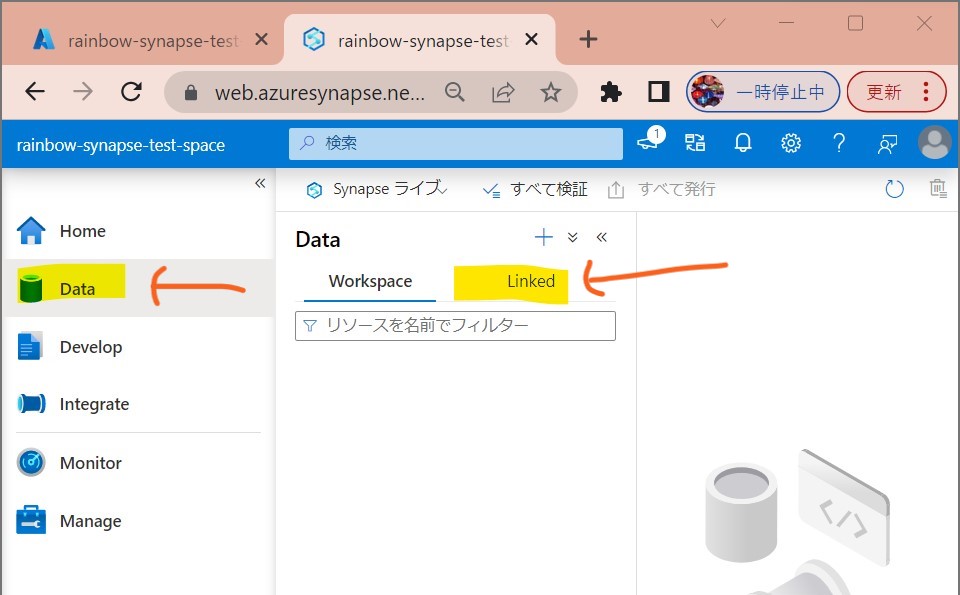
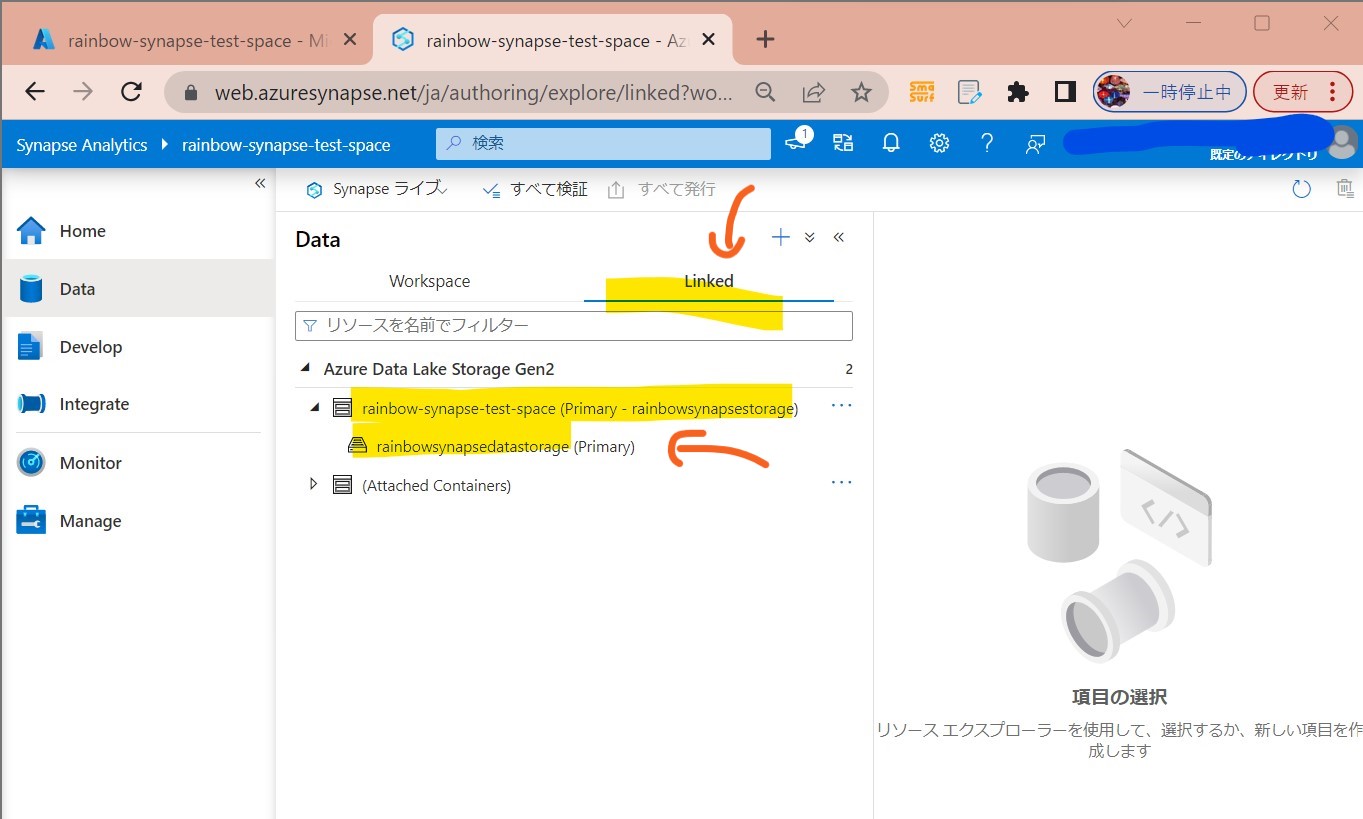
STEP1-4:アップロード
・①「Data」→「Linked」
(図221)
↓
・②ストレージを選択
(図222)
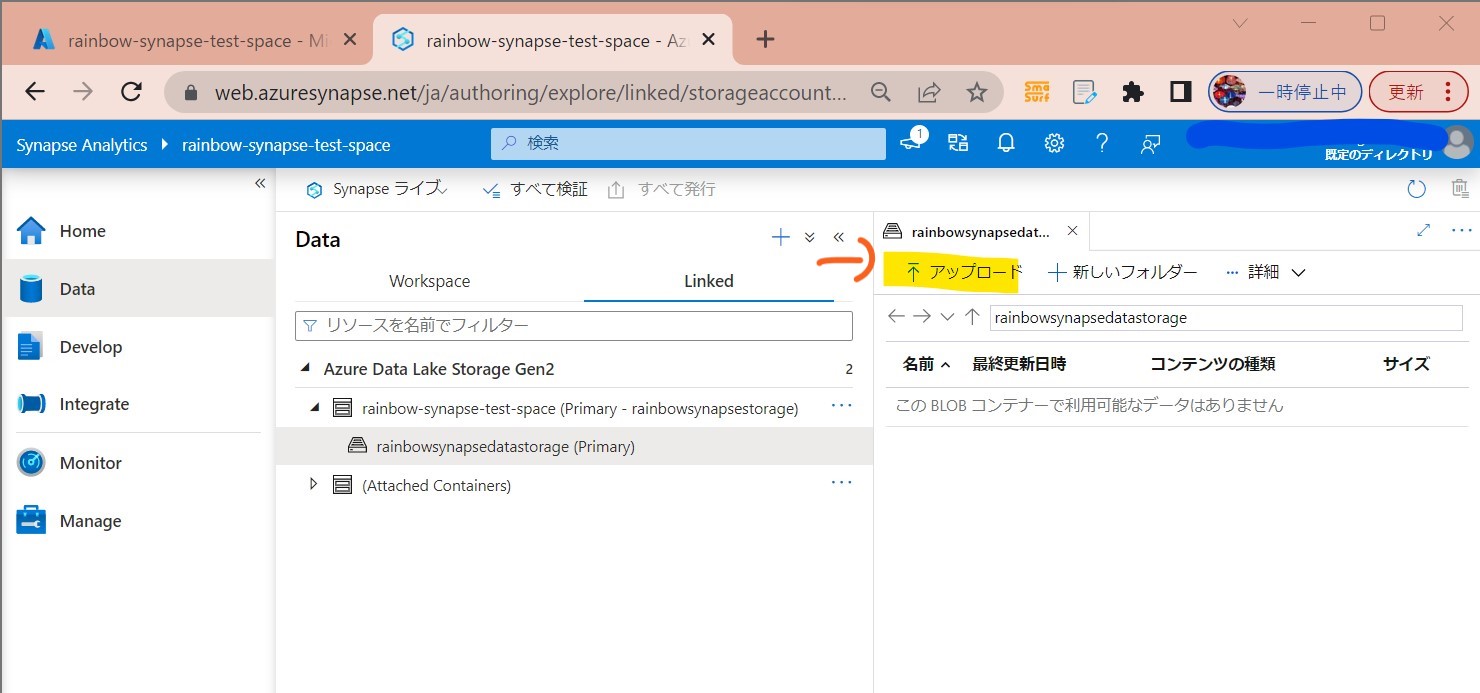
↓
・③「アップロード」
(図223)
↓
・④ファイル選択→「アップロード」
(図224)
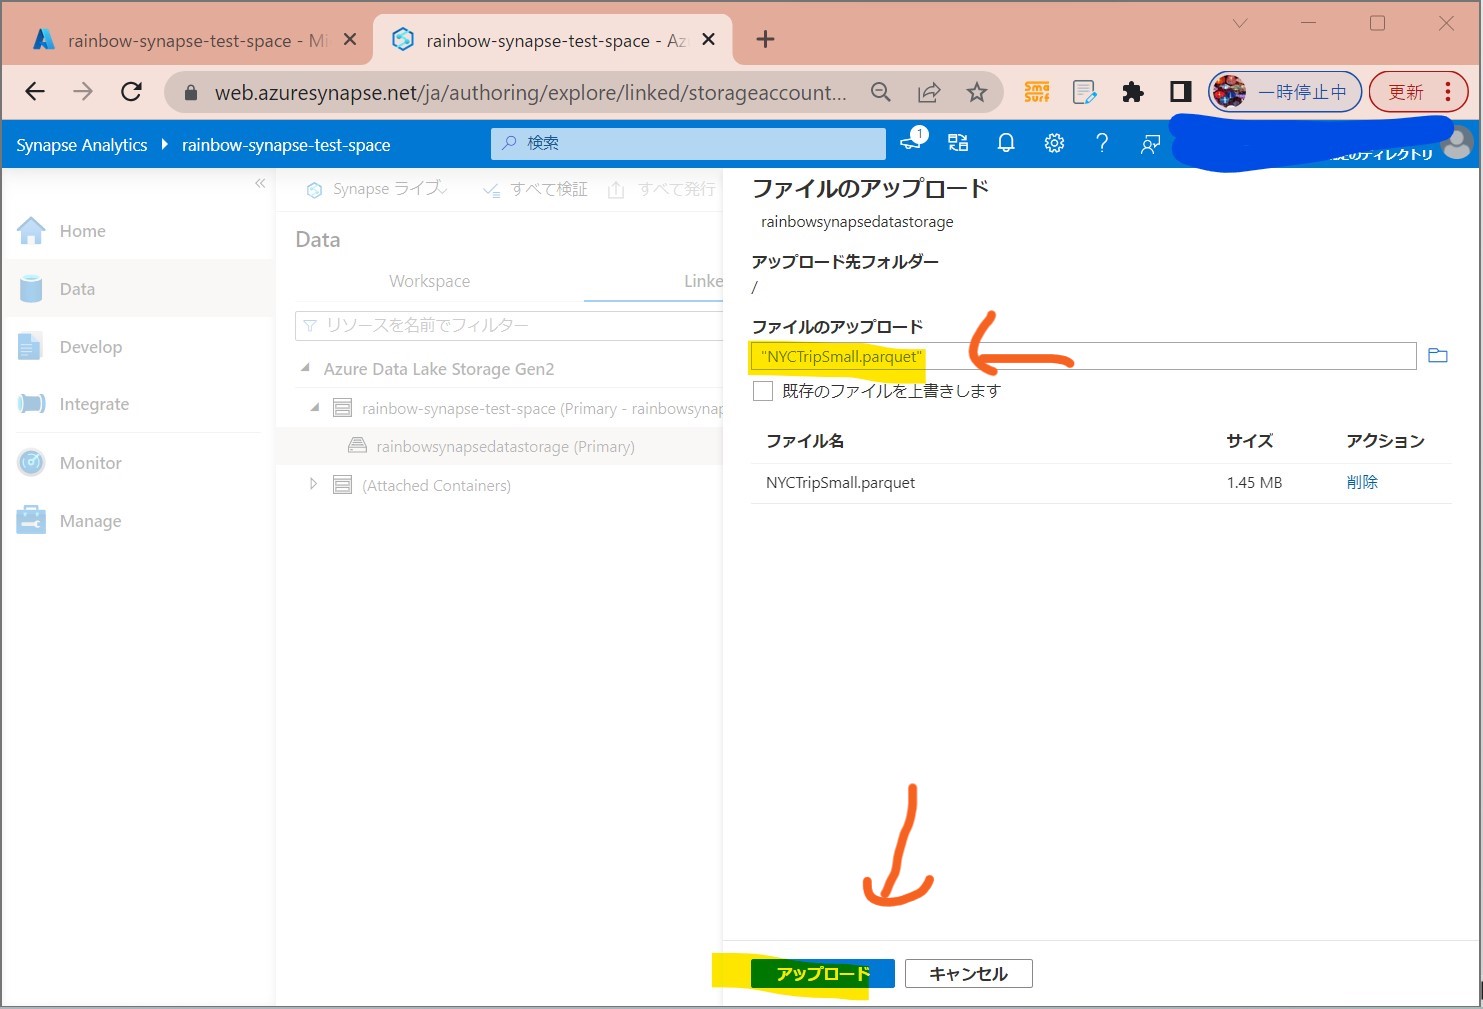
↓
・⑤アップロード完了
アップロード完了すると2つのURLから利用可能になる。
(構文)
https://[Data Lake Storageアカウント名].dfs.core.windows.net/users/NYCTripSmall.parquet
abfss:// [Data Lake Storage ファイルシステム名]@[Data Lake Storageアカウント名].dfs.core.windows.net/NYCTripSmall.parquet
(例)
https://rainbowsynapsestorage.dfs.core.windows.net/users/NYCTripSmall.parquet
abfss://rainbowsynapsedatastorage@rainbowsynapsestorage.dfs.core.windows.net/NYCTripSmall.parquet
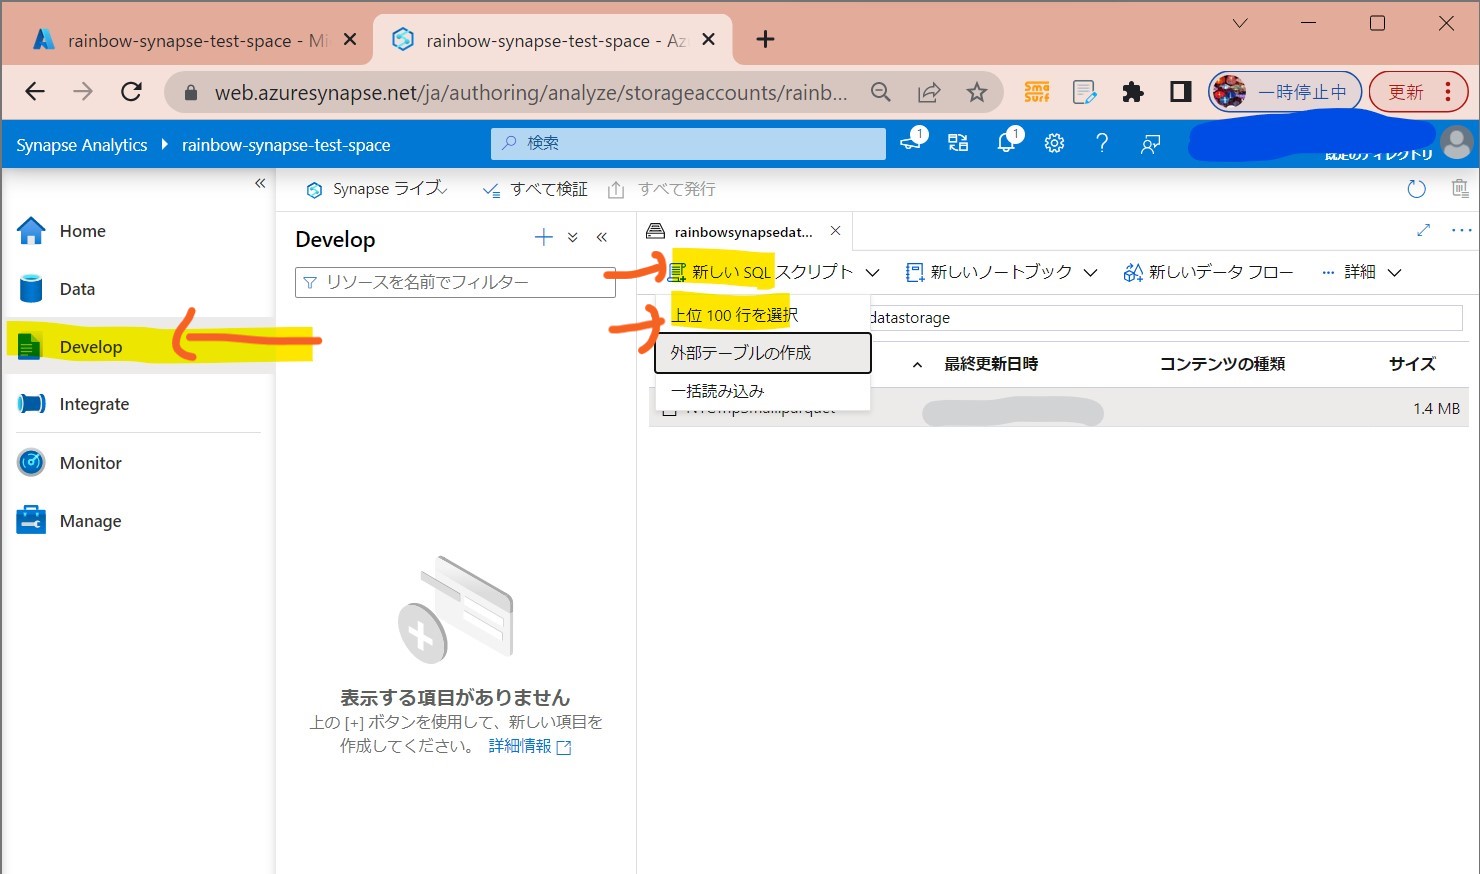
STEP2:「サーバレスSQLプール」を使った分析
・①左メニュー「Develop」→「新しいSQLスクリプト」→「上位100行を選択」
上位100件
(図231)
↓
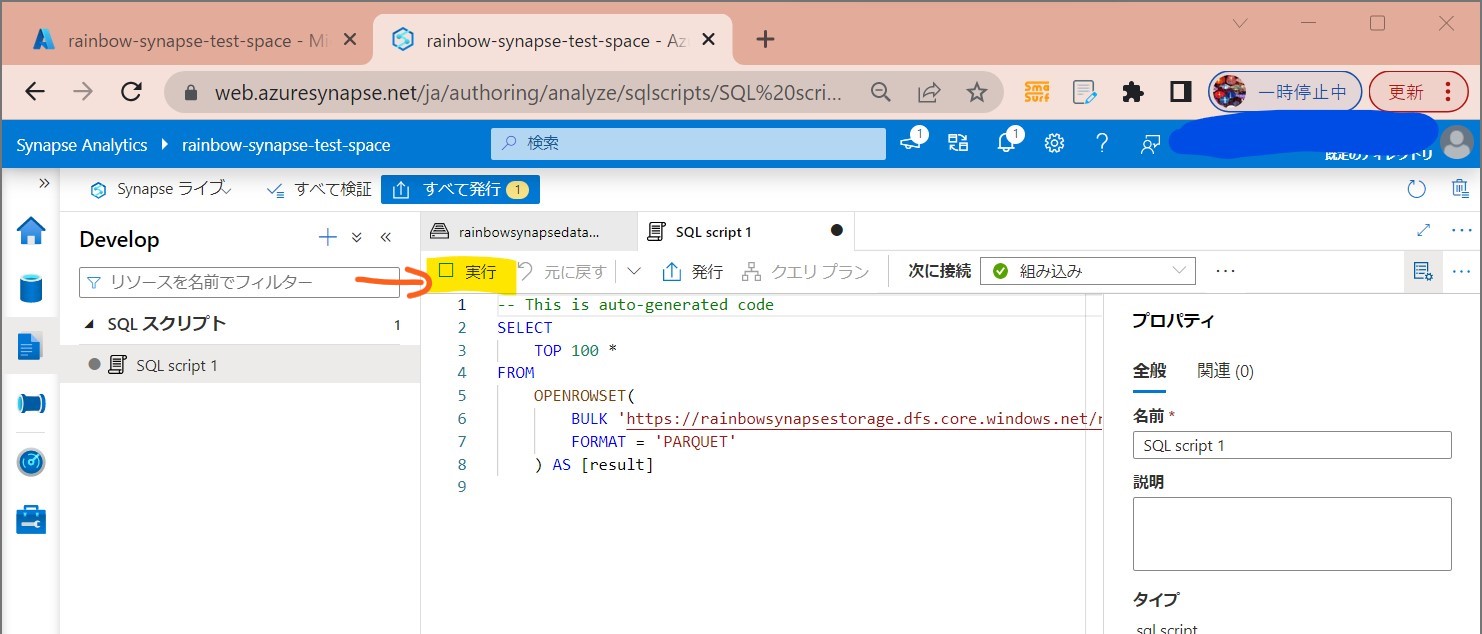
・②「実行」
(図232)
↓
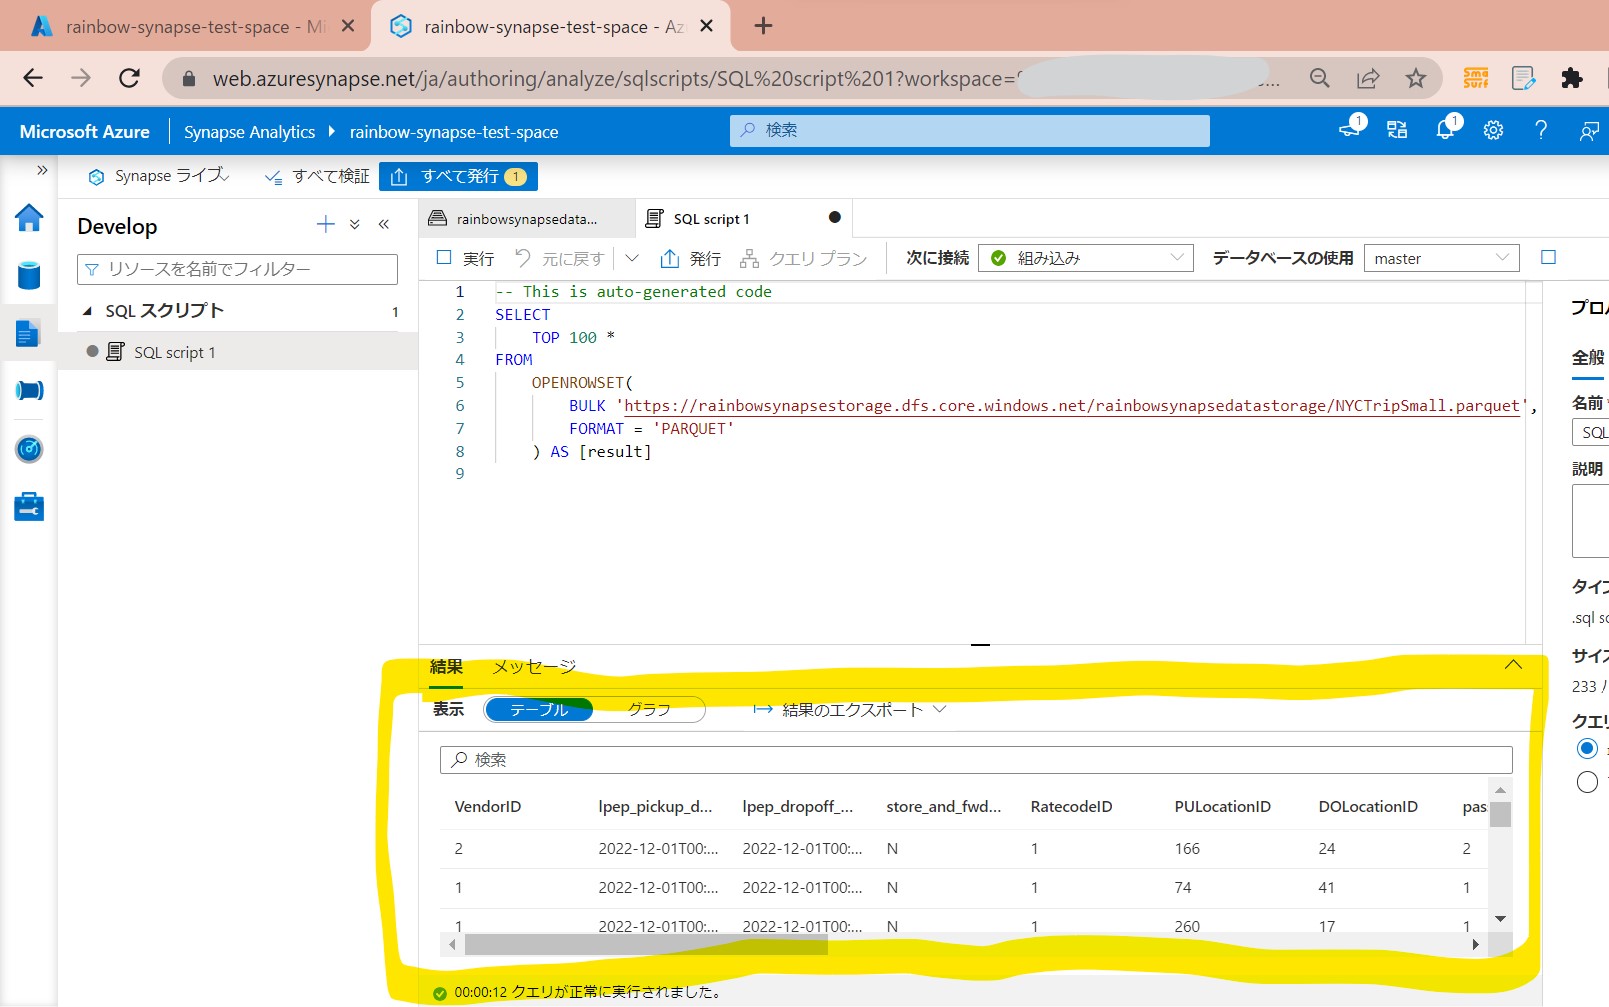
・③実行結果が表示される
(図233)
STEP3:「データエクスプローラー」を使った分析
STEP3-1:データエクスプローラーの「プール」作成
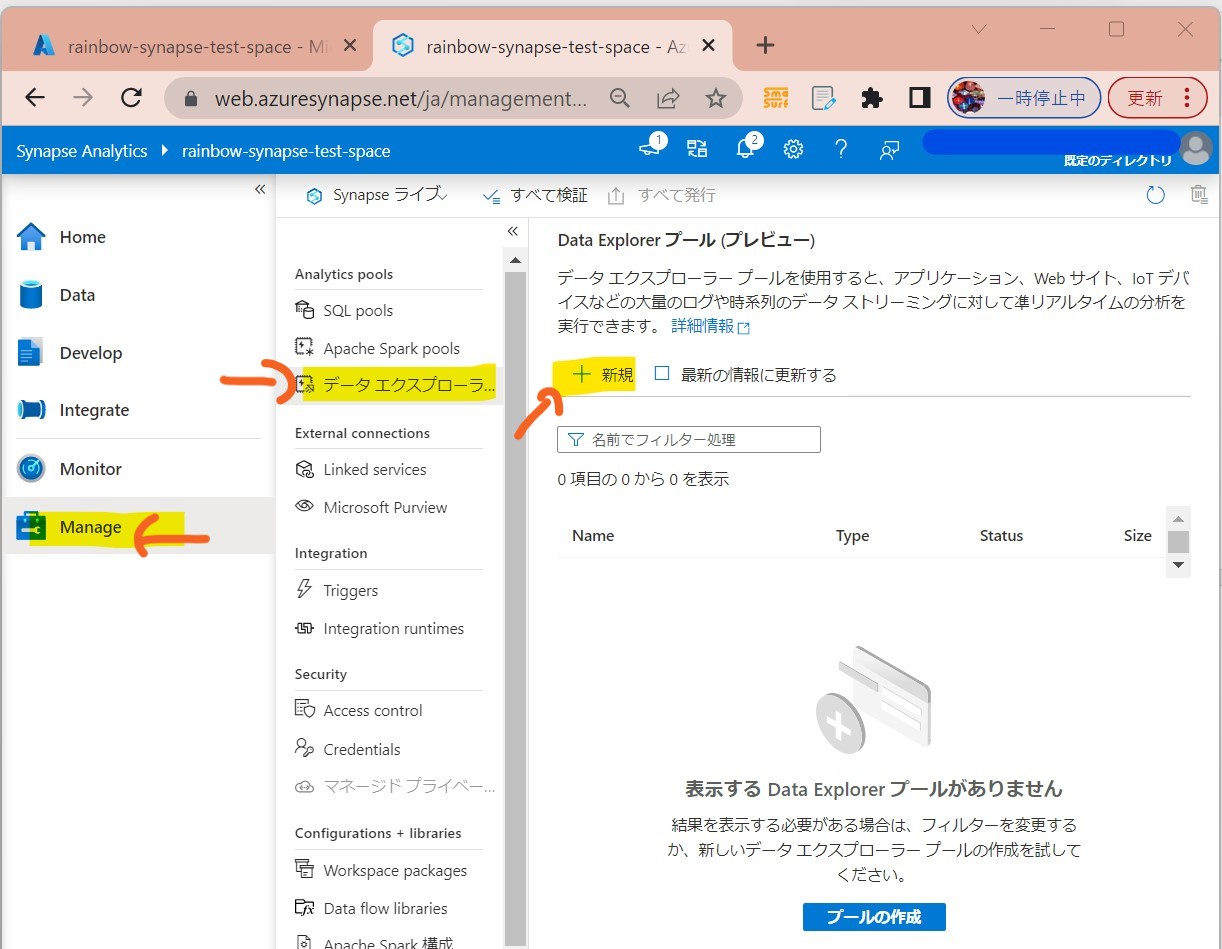
・①左メニューで「Data Explorer Pool」を選択
(図311)
↓
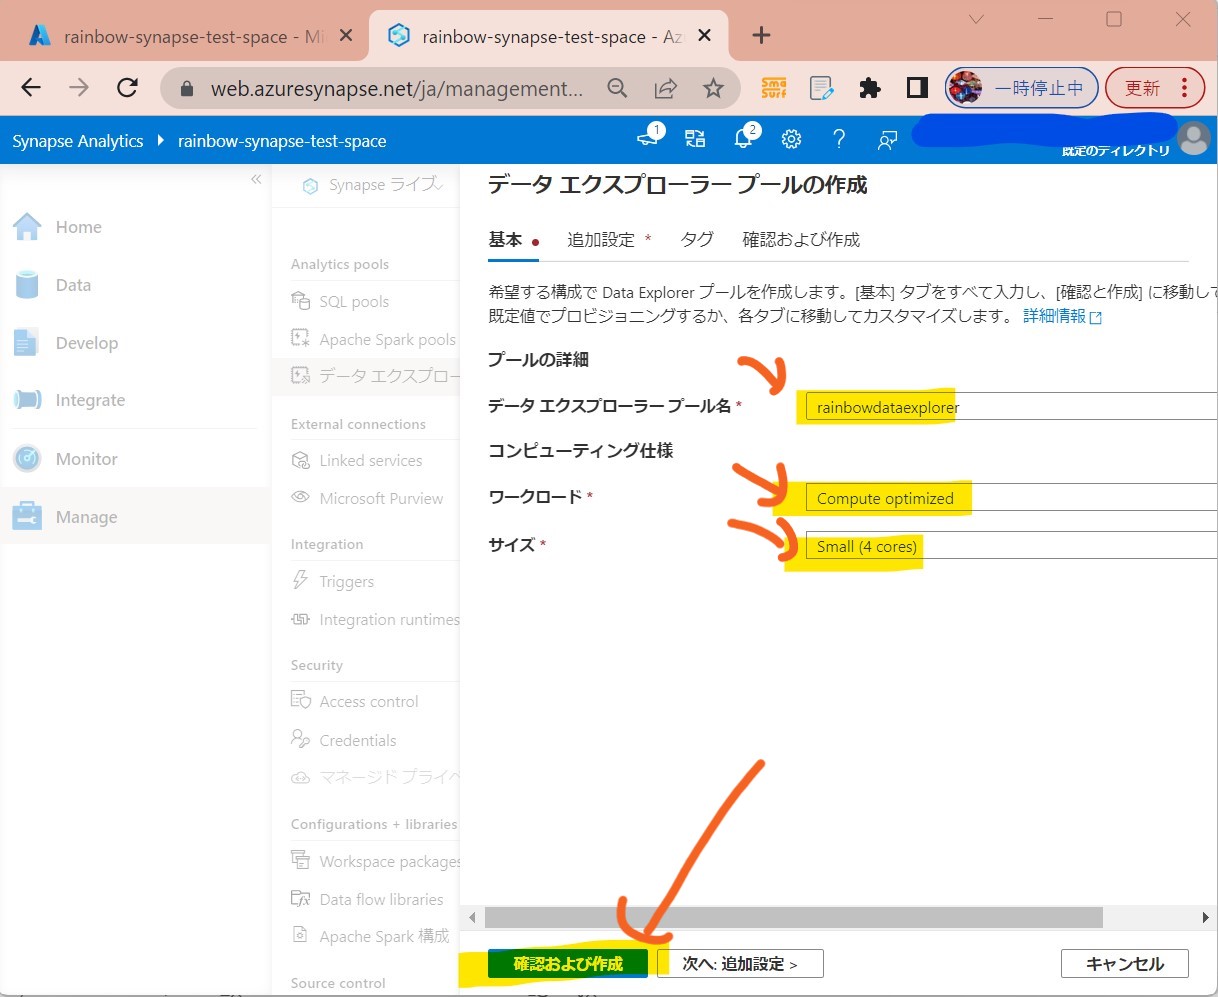
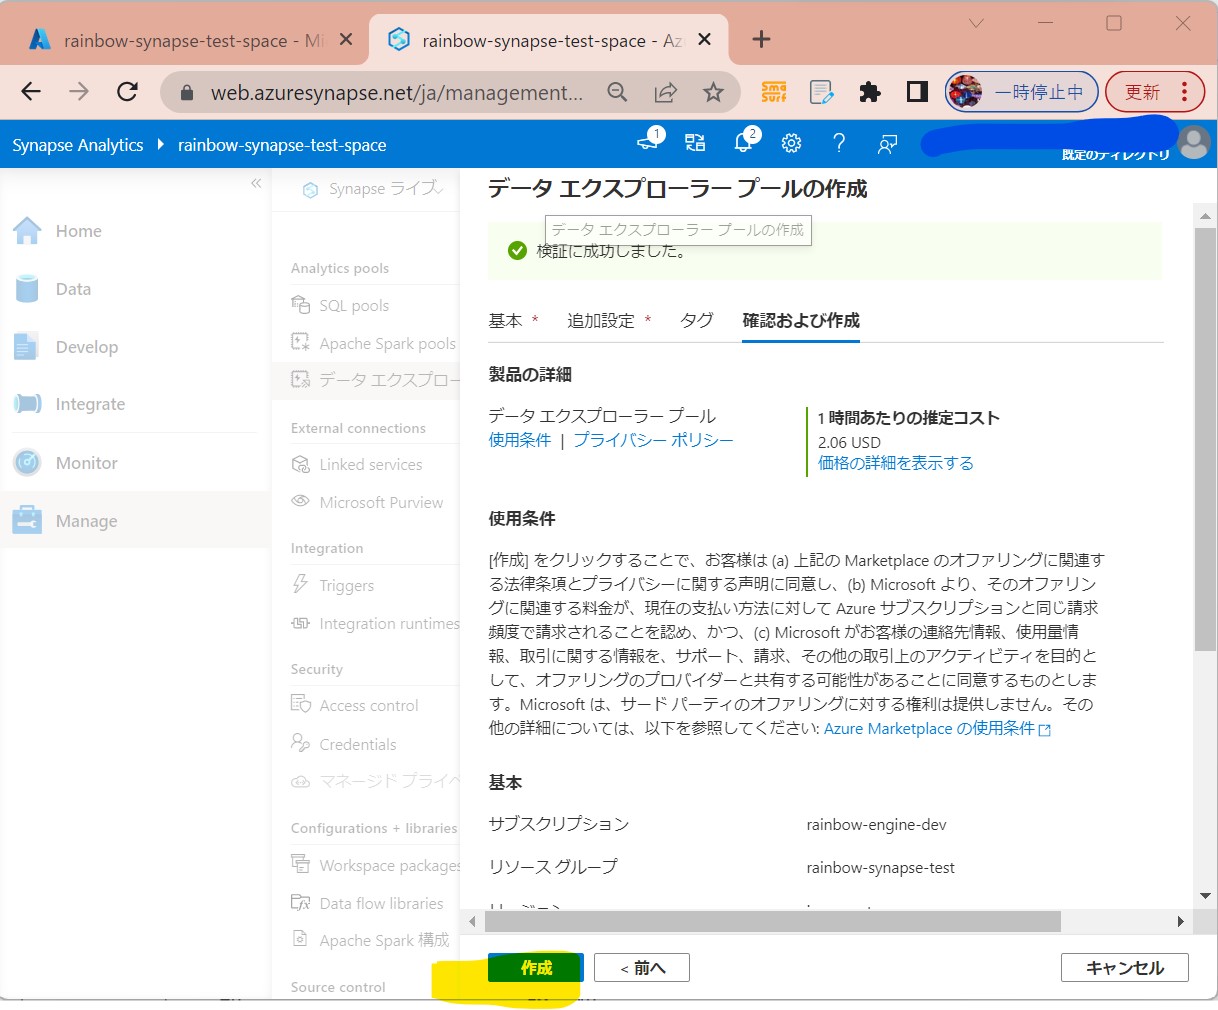
・②必要項目を入れて「確認および作成」
(図312)
↓
・③「作成」
(図313)
↓
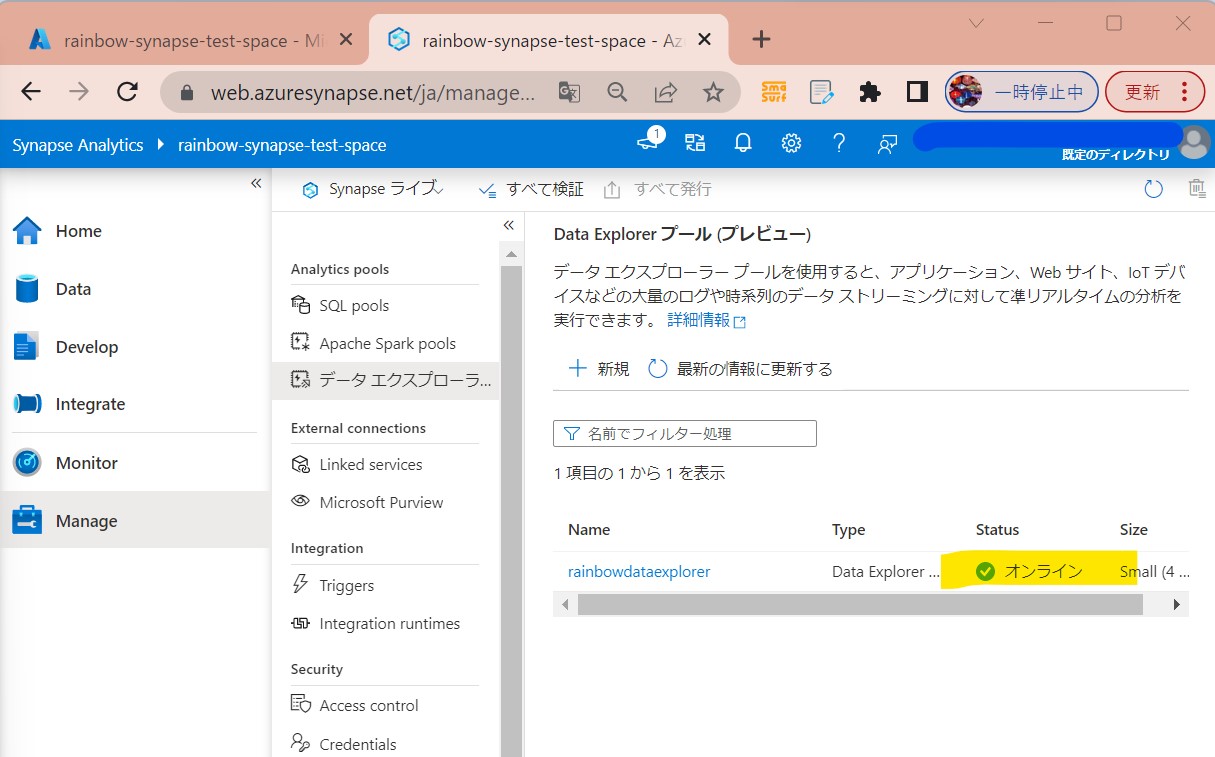
・④作成完了
(図314)
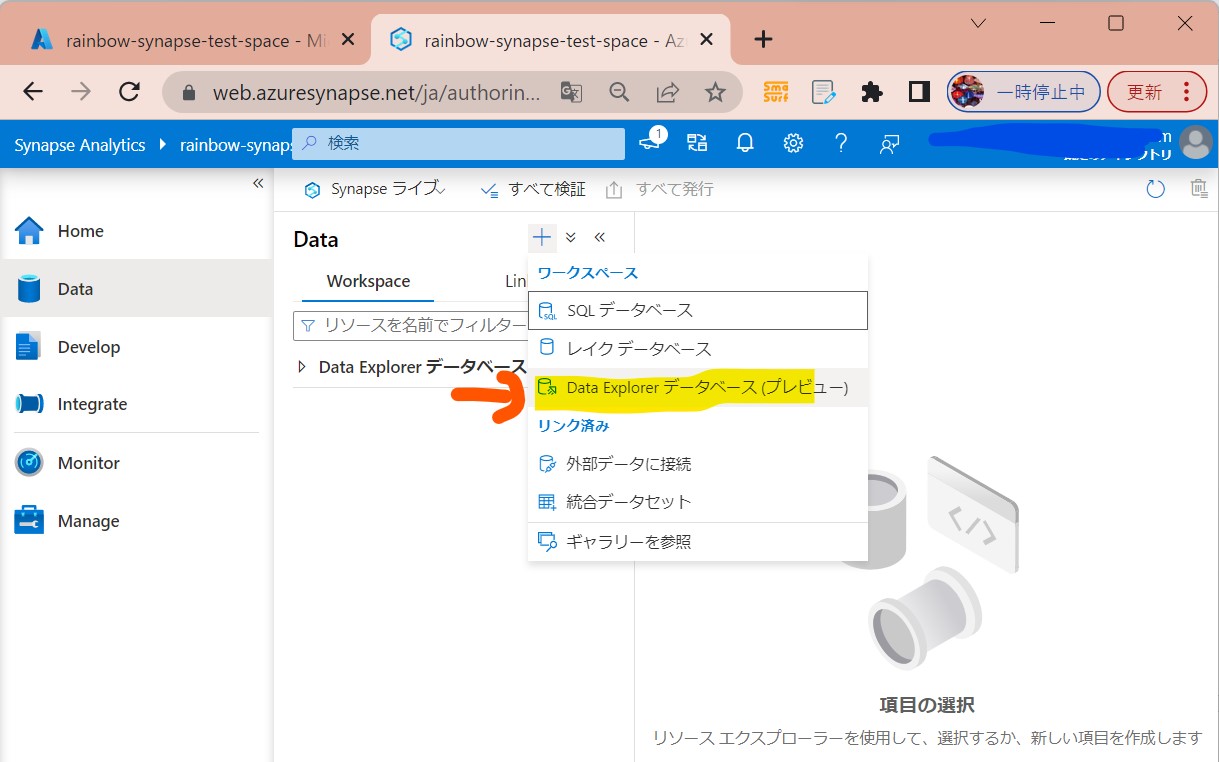
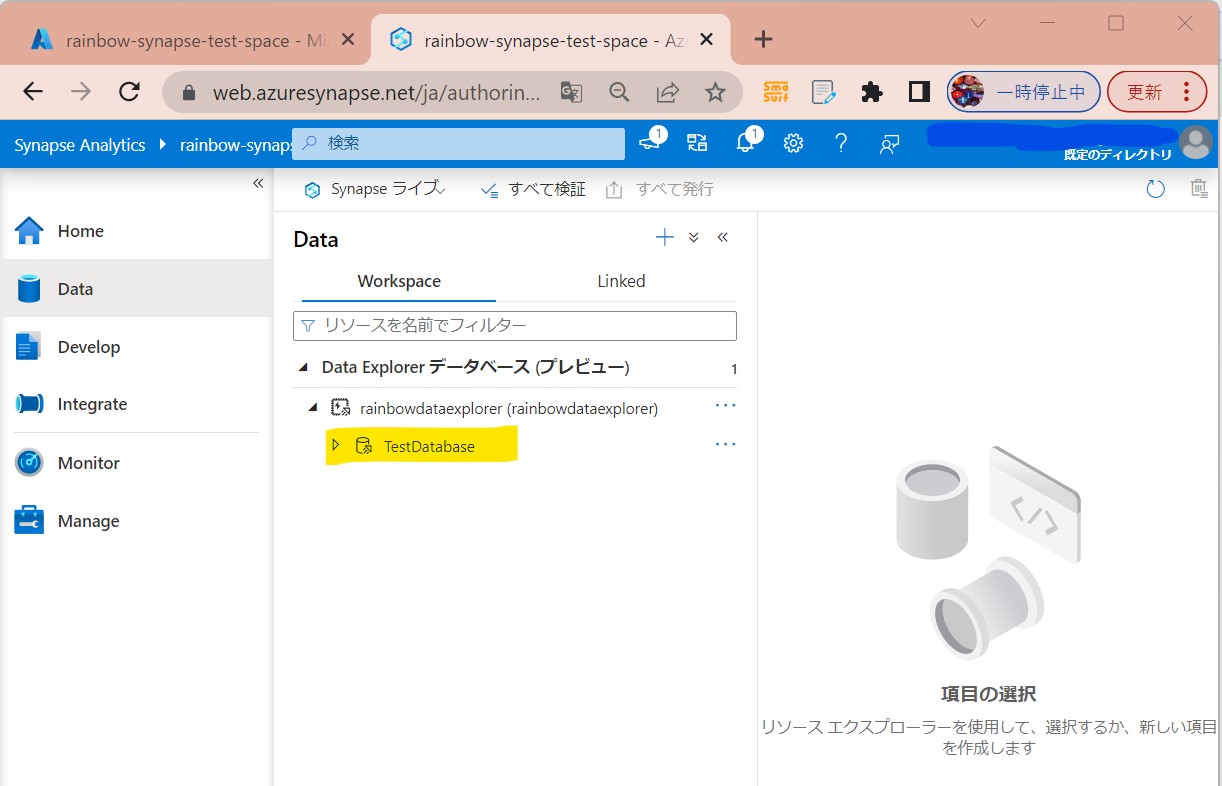
STEP3-2:データエクスプローラーの「データベース」作成
・①左メニューで「Data」を選択
(図321)
↓
・②必要項目を入れて「確認および作成」
(図322)
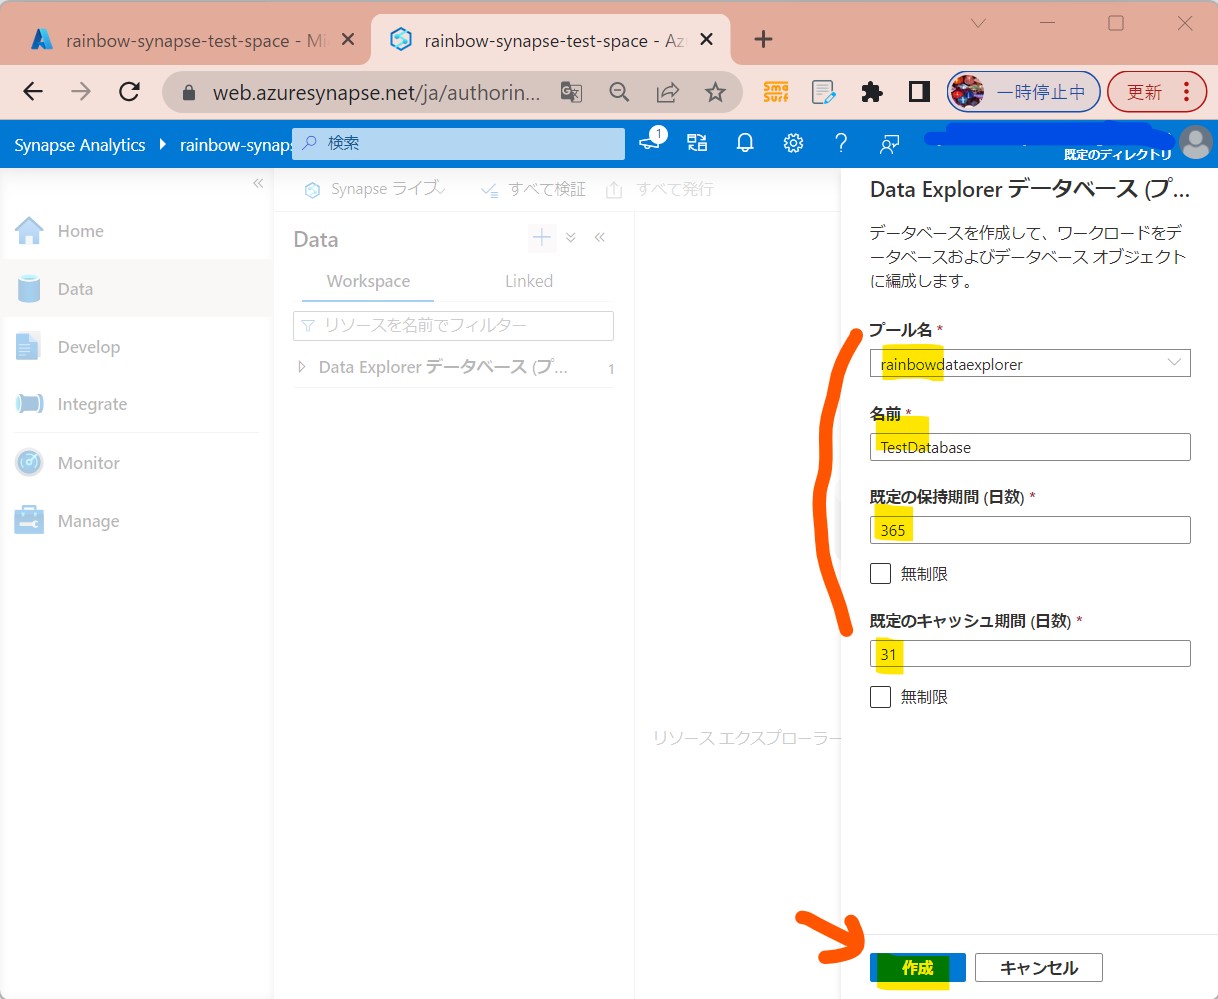
↓
・③作成完了
(図323)
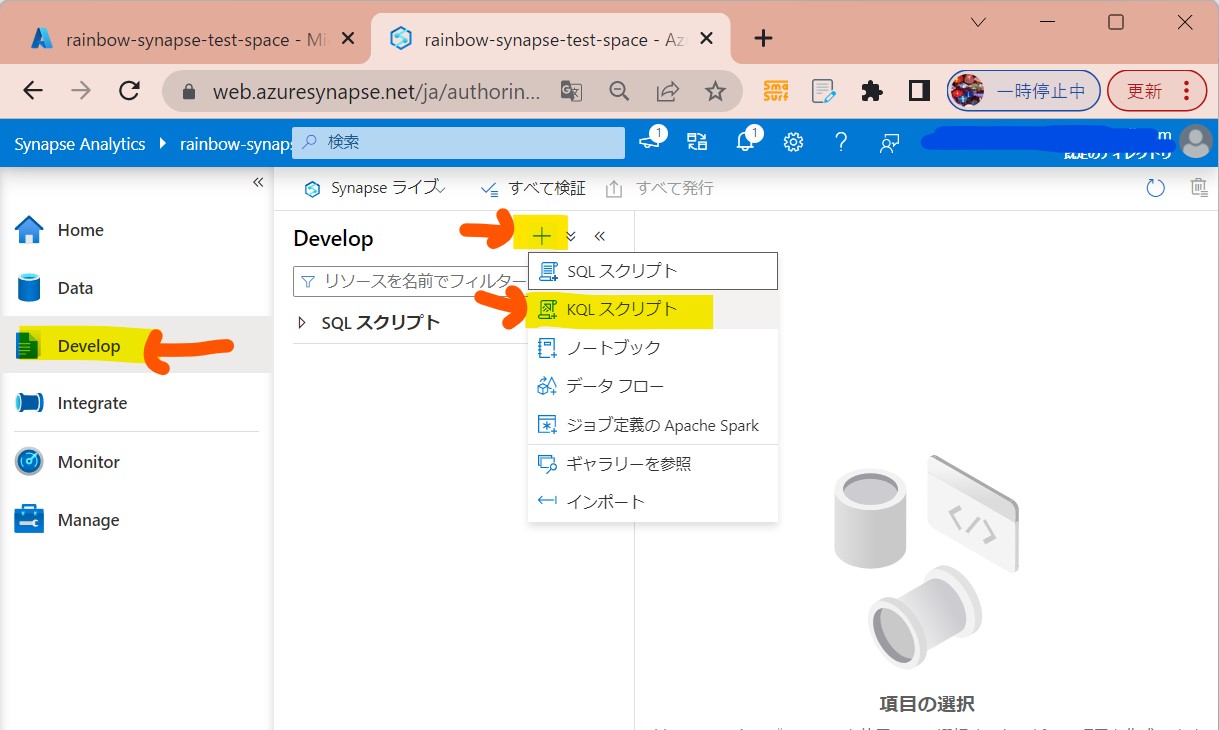
STEP3-3:簡単なクエリ実行(テーブル作成)
・①左メニュー「Develop」→「新しいSQLスクリプト」→「上位100行を選択」
(図331)
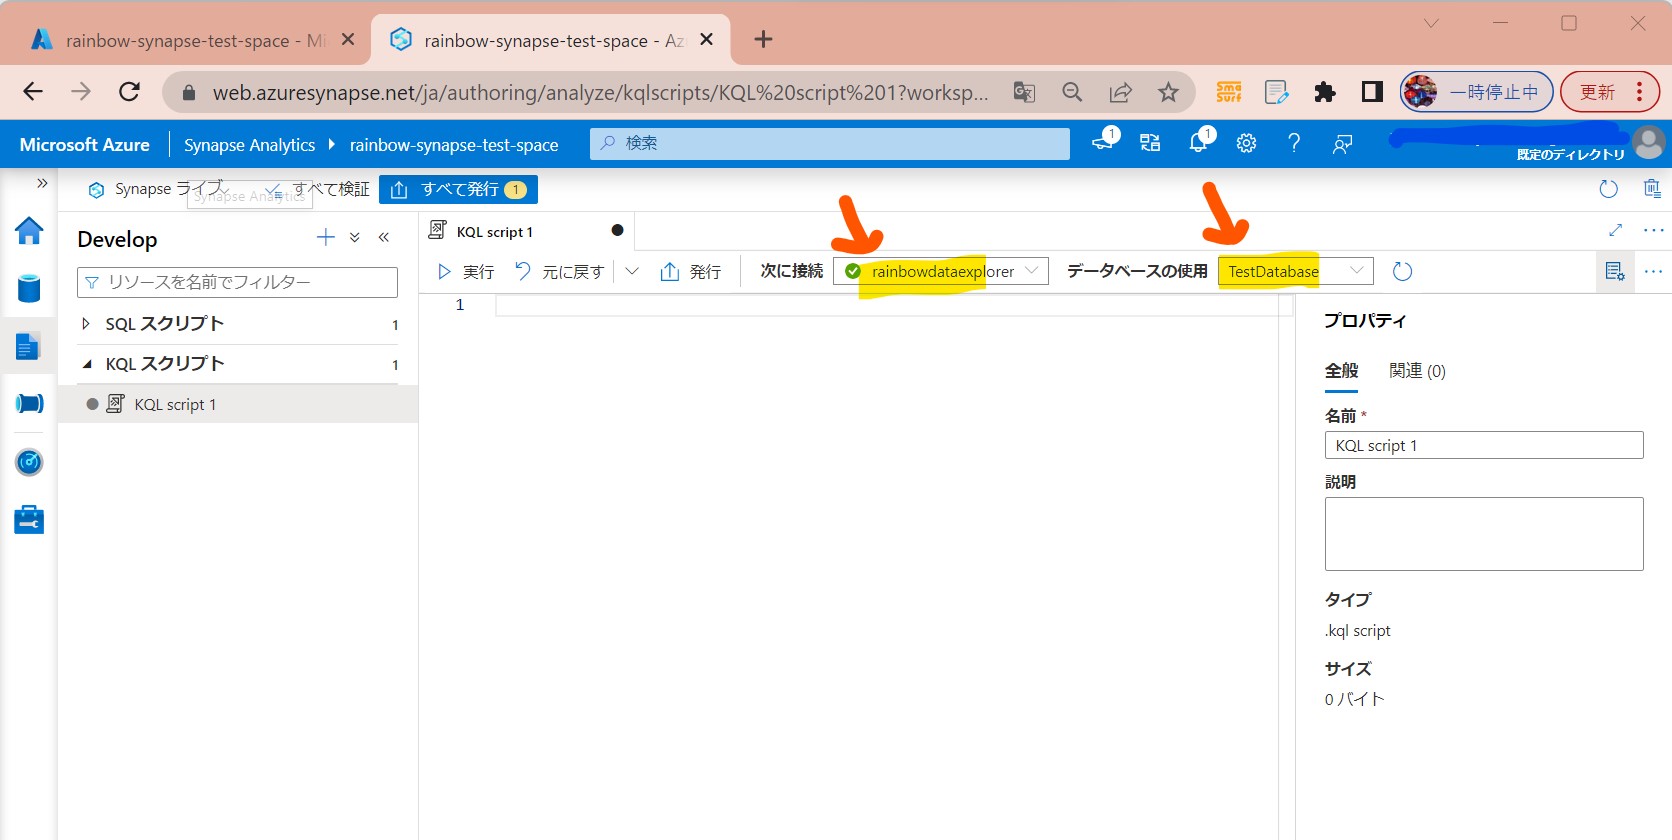
↓
・②「次に接続」で作成したExplorer poolを指定、「データベースの使用」で作成したExplorer databaseを指定
(図332)
↓
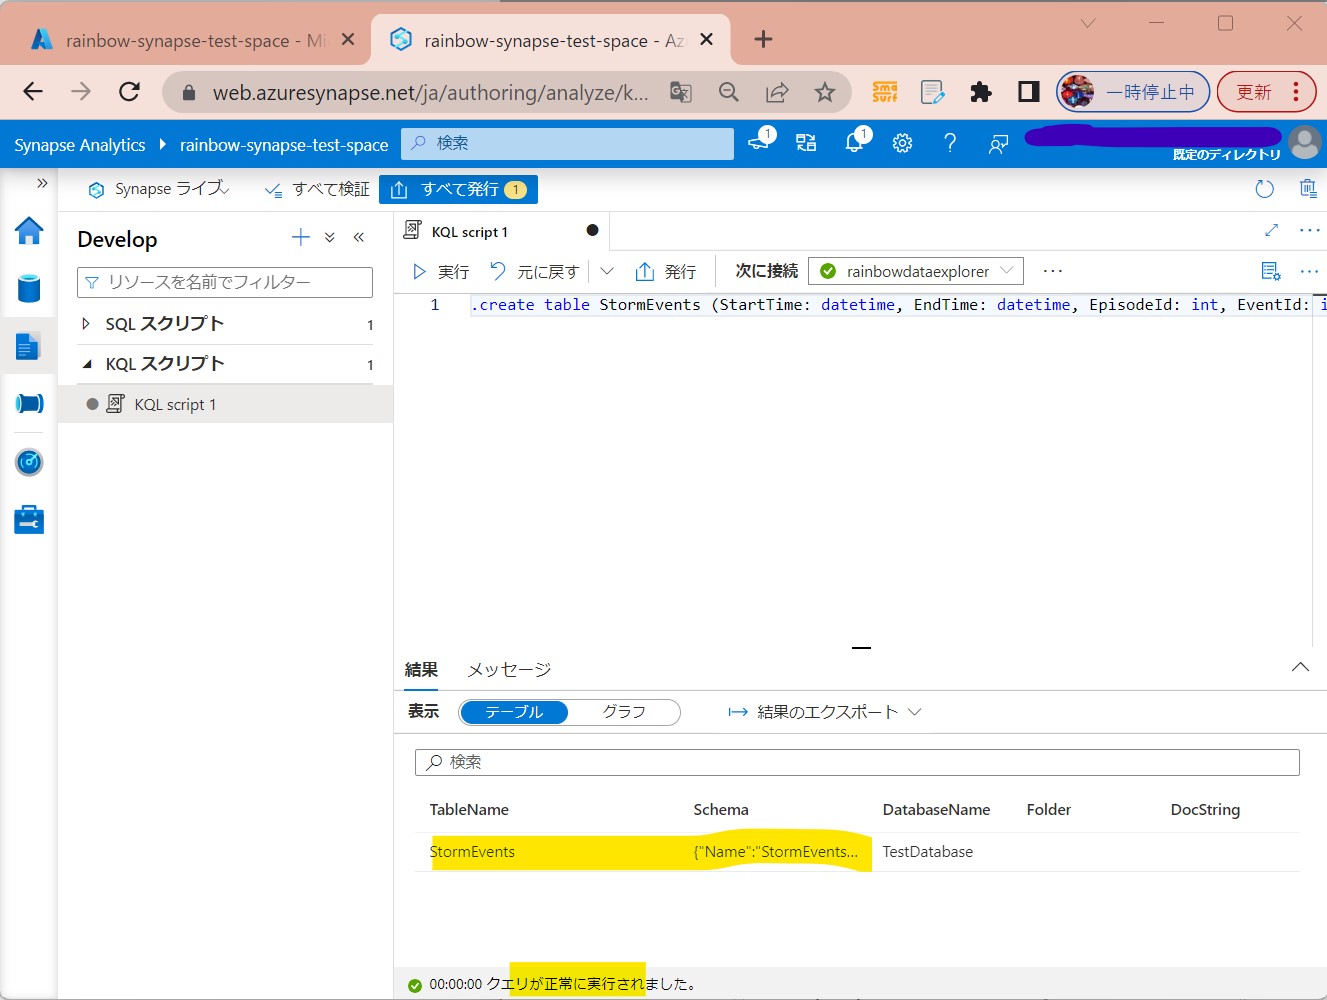
・③クエリを貼り付けて「実行」
.create table StormEvents (StartTime: datetime, EndTime: datetime, EpisodeId: int, EventId: int, State: string, EventType: string, InjuriesDirect: int, InjuriesIndirect: int, DeathsDirect: int, DeathsIndirect: int, DamageProperty: int, DamageCrops: int, Source: string, BeginLocation: string, EndLocation: string, BeginLat: real, BeginLon: real, EndLat: real, EndLon: real, EpisodeNarrative: string, EventNarrative: string, StormSummary: dynamic)
↓
・④実行結果が表示される
(図334)
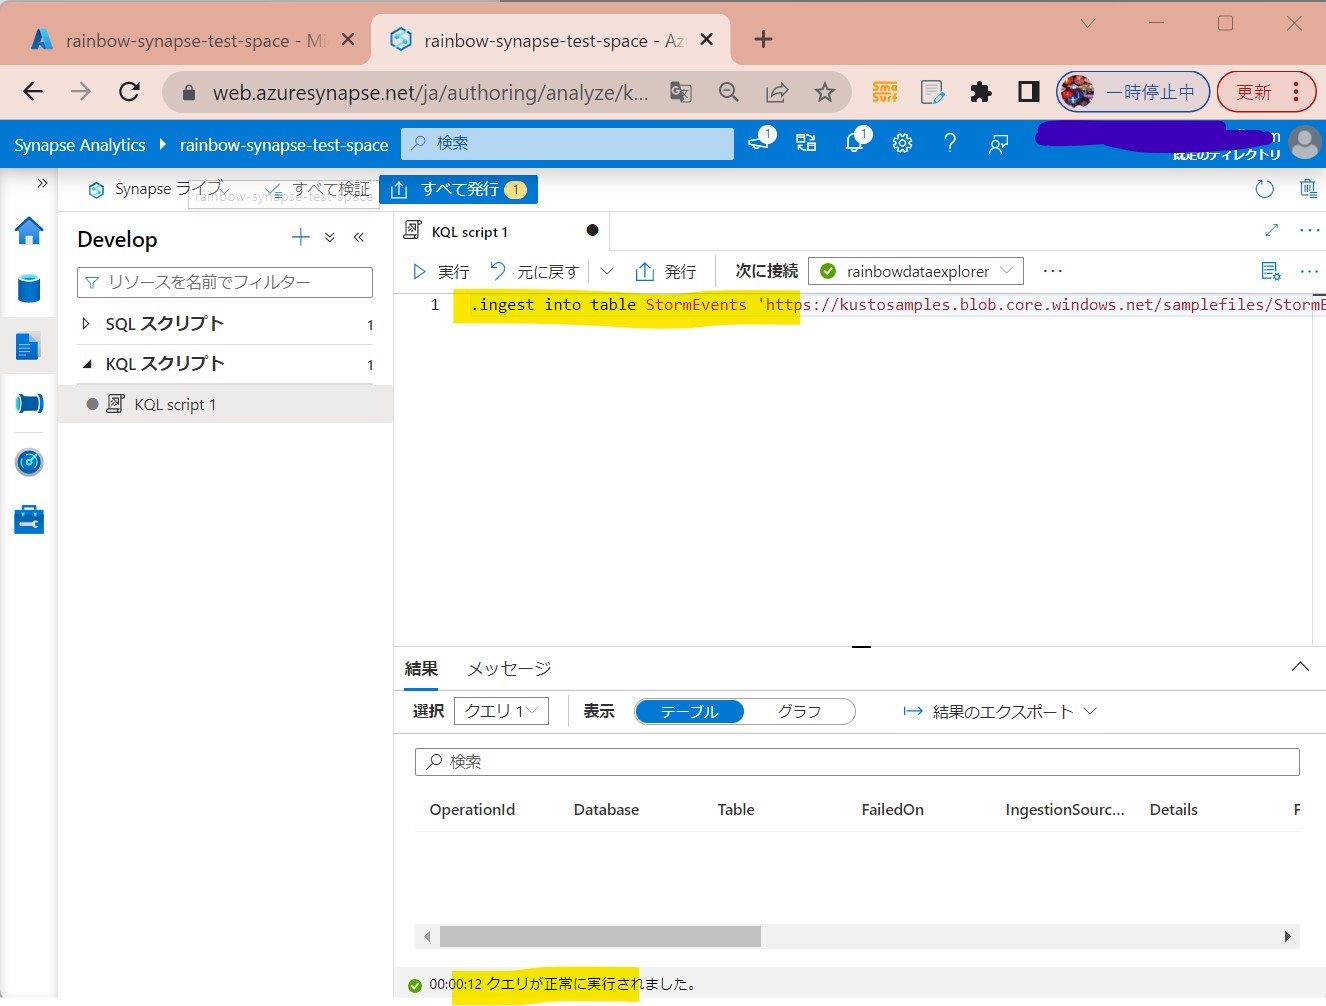
STEP3-4:簡単なクエリ実行(レコード挿入)
・①下記クエリを貼り付けて「実行」
.ingest into table StormEvents 'https://kustosamples.blob.core.windows.net/samplefiles/StormEvents.csv' with (ignoreFirstRecord=true)
(図341)
↓
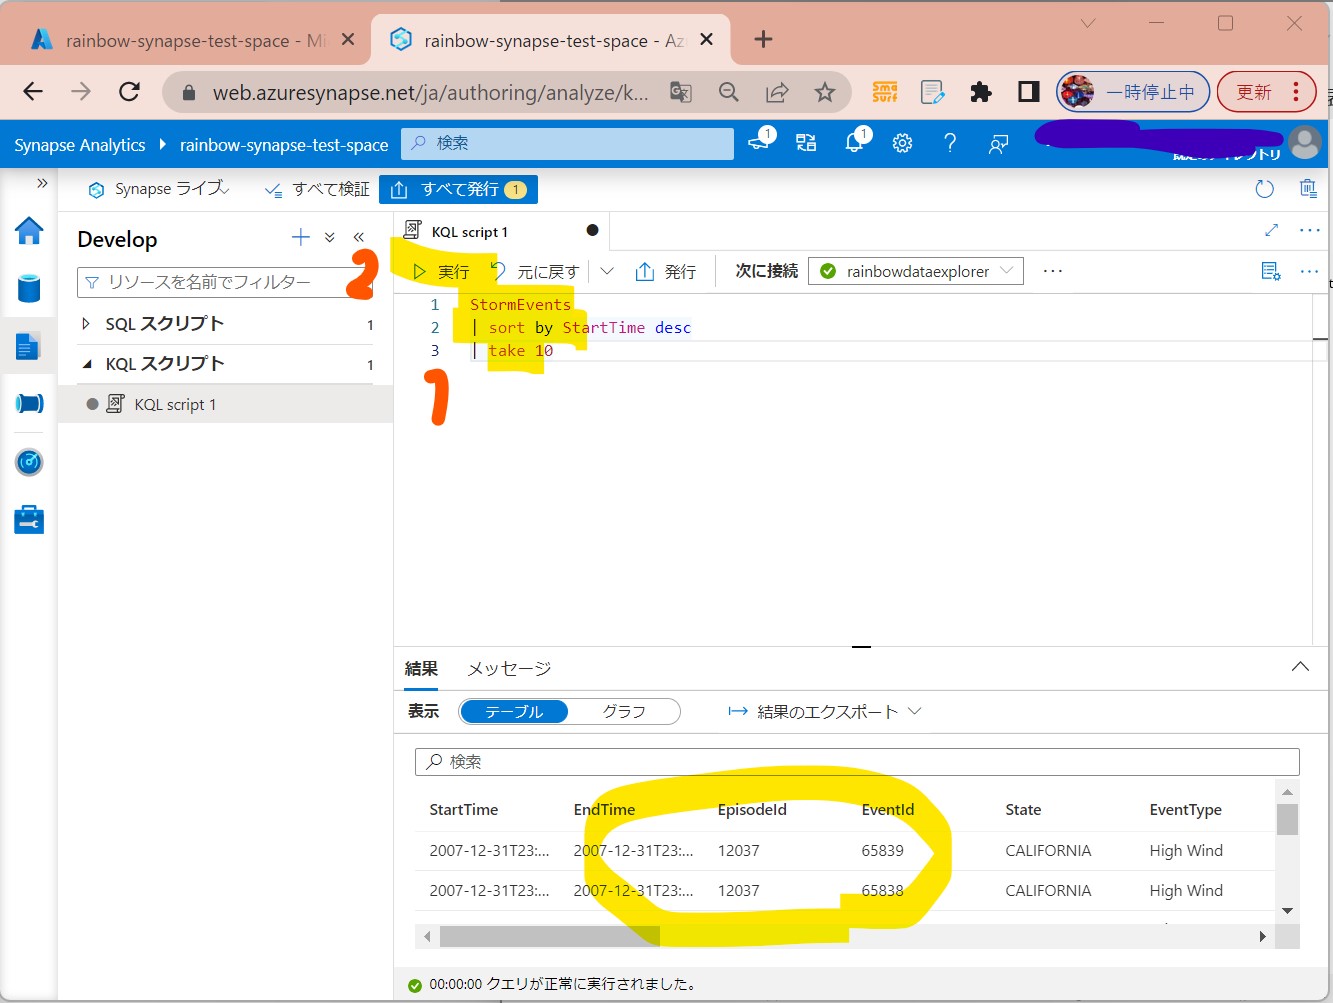
・②下記クエリを貼り付けて「実行」(結果確認)
StormEvents
| sort by StartTime desc
| take 10
(図342)
STEP4:REST APIからのデータ取得
STEP5:パイプラインとの連携
【注意】Azure Synapse Analyticsの料金について
非常に強力な分、料金も他のAzureサービスと比較すると高いので、注意が必要。